Disease Detectives
2027 season
On this page(21 sections)
Disease Detectives is epidemiology as a competition: the study of how disease, injury and health are distributed across groups of people, what drives that distribution, and how to use the answers to protect the public. You will not be asked which bacterium causes a disease or how long its incubation period is; when a question needs those facts, the test can supply them as background. What the event rewards is the way a field epidemiologist thinks. You read a scenario, decide whether something unusual is happening, organize the data into a table, compute the right measure, judge whether an exposure really caused the illness, and recommend what to do next.
Event format
| Item | 2027 rules (both divisions) |
|---|---|
| Team | Up to 2 students |
| Time | About 50 minutes |
| Notes | One 8.5" × 11" sheet, both sides, any content from any source; it may be laminated or kept in a sheet protector. No extra sheets, no affixed labels |
| Calculators | Up to two Class II calculators per team (scientific, non-programmable, non-graphing; see the calculator classes in the general rules) |
| Other | Writing utensils. No lab work, no eye protection, nothing to build |
| Test style | Written test, mostly built around case scenarios; the three topic areas carry about equal weight; questions aim at broad, basic understanding rather than detailed, advanced knowledge |
| Scoring | Highest score wins; preselected questions break ties; points reward correct answers, the quality of your reasoning and proper scientific method |
The event runs in partnership with the CDC, and the rules point to the glossary of CDC's Principles of Epidemiology in Public Health Practice as the vocabulary standard. That free online textbook is the closest thing the event has to a syllabus.
What the rules cover
The 2027 rules split the event into three areas of roughly equal weight: Background & Surveillance, Outbreak Investigation, and Patterns, Control, and Prevention. Questions are meant to be process-oriented: interpreting data and evaluating evidence, not reciting lists. The table paraphrases the outline (rules section 3.b.i–iii of each division's event rules).
| Area | Both divisions, all levels | Division B | Division C |
|---|---|---|---|
| Background & Surveillance | Clinical vs public health approach; history of epidemiology; roles of epidemiology and the steps in solving health problems; natural history and spectrum of disease; infectious (bacterial, viral, fungal, protist, prion) and noninfectious causes in broad terms; CDC glossary terms; surveillance: purpose, 5-step process, types, attributes | Same as both | Same as both |
| Outbreak Investigation | Case scenarios; experimental vs observational studies and the main designs (case-control, cohort, ecological, cross-sectional) with pros and cons; outbreak investigation steps; person–place–time and case definitions; reading outbreak data (epi curves, line listings, cluster maps, subdivided tables) and lab typing (PFGE gels, SNP mapping, the PulseNet network); agent–host–environment triad and chain of transmission; attack rate, relative risk, odds ratio, and judging whether the data support or require revising a hypothesis; Bradford Hill criteria vs Koch's and Evans's postulates, DAGs, sufficient–component cause models, GRADE | State & Nationals: study design, bias, error and confounding; herd immunity (concept) and vaccine effectiveness and efficacy | All levels: bias, error and confounding; choosing control groups and data collection methods; limitations; interpreting confidence intervals; stratification and adjusted rates; vaccine effectiveness and efficacy; herd immunity threshold, R₀ and effective R. Nationals: proposing control and prevention measures |
| Patterns, Control, and Prevention | Patterns and trends in charts, tables and graphs; risk, ratios, proportions, incidence proportion (attack rate), incidence rate, prevalence, death and mortality rates; strategies of disease control; prevention, including its scope and levels | Same as both | All levels: proposing prevention strategies once your analysis finds the cause. Nationals: strengths and weaknesses of proposed strategies; judging effectiveness from pre- and post-intervention data |
The two Division B State & Nationals items (bias/confounding, and herd immunity with vaccine effectiveness) are new to Division B in the 2027 rules. Division C's outline is unchanged.
Background: the public health way of thinking
Clinical approach vs public health approach
A physician practicing the clinical approach has one patient: take a history, examine, diagnose, treat, follow up. The public health approach treats the whole population as the patient. It runs as a loop: define the problem with data (surveillance), find the causes and risk factors (epidemiologic studies), develop and test interventions, then put them into wide use and evaluate them. A question asking what "the health department should do" wants population-level actions such as case finding, control measures and public communication, not a treatment plan for one person.
The two approaches depend on each other. Clinicians recognize and report unusual cases, which feeds surveillance; epidemiologists return findings, such as risk factors and screening recommendations, that change clinical care.
What epidemiology does
Epidemiology has two halves. Descriptive epidemiology organizes cases by person (age, sex, occupation, behavior), place (residence, workplace, travel) and time (onset date, season, trend). It answers who, where and when and generates hypotheses. Analytic epidemiology compares groups (exposed vs unexposed, or cases vs controls) to test those hypotheses and answers how and why.
CDC describes the core functions of epidemiology in public health as surveillance, field investigation, analytic studies, evaluation of programs, linkages with other agencies and data sources, and policy development. Its uses include assessing community health, informing individual decisions, completing the clinical picture of a disease, and searching for causes.
The CDC definition, word by word. CDC defines epidemiology as the study of the distribution and determinants of health-related states or events in specified populations, and the application of this study to the control of health problems. Tests pull this sentence apart:
- Distribution is the frequency and pattern of disease: counts and rates by person, place and time (descriptive epidemiology).
- Determinants are the causes and factors that influence whether disease occurs: agents, causes, risk factors and sources. Control measures are not determinants; they belong to application.
- Application is putting the findings to use: a vaccination campaign recommended by an investigation is application.
- Health-related states or events include injuries, births, behaviors and chronic disease, not only infections.
The public health approach in four steps
The public health approach to any problem, from injuries to an infection, runs through four questions, each answered by a step:
| Step | Question | What happens |
|---|---|---|
| 1. Define the problem (surveillance) | What is the problem? | Collect data on who, where, when and how many |
| 2. Identify risk factors (etiology) | What is the cause? | Epidemiologic studies find causes and risk factors |
| 3. Develop and test interventions | What works? | Design programs and evaluate them, often in trials |
| 4. Implement (and evaluate) | How do you do it? | Put the effective program into wide use and track its effect |
Some tests phrase the same idea as "problem → etiology → recommendations → implementation." The steps feed each other: after implementation, surveillance resumes to see whether the problem shrank.
Public health itself is often defined (after C.-E. A. Winslow, 1920) as the science and art of preventing disease, prolonging life and promoting health through organized community efforts; the CDC Foundation's modern version says "organized efforts and informed choices of society, organizations, public and private communities, and individuals." CDC lists the public health core sciences as epidemiology, surveillance, laboratory science, informatics, and prevention effectiveness (economics and evaluation). Three core functions of public health are assessment (monitor health and diagnose problems), policy development (inform, mobilize partners, make plans and laws) and assurance (enforce laws, link people to services, keep a competent workforce, evaluate). The 10 Essential Public Health Services spread across these three: monitor health status; diagnose and investigate health problems and hazards; inform and educate; mobilize community partnerships; develop policies and plans; enforce laws and regulations; link people to needed health services; assure a competent workforce; evaluate services; and research for new solutions (CDC revised the wording in 2020 and placed equity at the center, but the ten areas are the same).
Clinical epidemiology applies epidemiologic methods to patient care in clinical settings (diagnostic tests, prognosis, treatment trials); classical epidemiology is population-oriented and studies community origins of health problems. Clinical medicine and the clinical approach still focus on the individual.
Public health agencies and the big picture
| Organization | What it does |
|---|---|
| CDC (Centers for Disease Control and Prevention) | U.S. federal agency for disease prevention and control, headquartered in Atlanta, Georgia; founded in 1946 as the Communicable Disease Center, largely through the vision of Joseph Mountin, who is considered its founder; publishes the MMWR; runs PulseNet, NNDSS and the Epidemic Intelligence Service (EIS, 1951) |
| WHO (World Health Organization) | United Nations agency for international public health, founded 1948, headquartered in Geneva, Switzerland; declares Public Health Emergencies of International Concern and pandemics (COVID-19 was declared a pandemic on 11 March 2020) |
| NIH (National Institutes of Health) | U.S. medical research agency (Bethesda, Maryland) |
| FDA | Regulates drugs, vaccines, medical devices and most foods |
| USDA (FSIS) | Safety of meat, poultry and processed egg products |
| EPA | Environmental hazards: air, drinking water, pollutants |
| OSHA and NIOSH | Workplace safety: OSHA (Department of Labor) sets and enforces rules; NIOSH, the National Institute for Occupational Safety and Health, is part of CDC and does the research |
| CSTE (Council of State and Territorial Epidemiologists) | With CDC, decides which conditions are nationally notifiable |
| State and local health departments | Receive case reports, decide which diseases are reportable in their jurisdiction, run most outbreak investigations |
| ECDC | The European Union's counterpart to CDC (Stockholm) |
| Other national public health institutes | Counterparts of CDC in other countries: the UK Health Security Agency (formerly Public Health England), the Public Health Agency of Canada, China CDC, the Africa CDC (a continental agency of the African Union), Germany's Robert Koch Institute, France's Santé publique France |
CDC grew out of the wartime Malaria Control in War Areas program (1942), which was based in Atlanta because malaria was still common in the U.S. South; Emory University later provided land for the permanent campus. CDC estimates that each year in the United States foodborne illness makes about 48 million people sick (1 in 6), sends about 128,000 to the hospital and kills about 3,000.
Under the International Health Regulations (IHR, 2005), countries must notify WHO within 24 hours of assessing any event that may be a public health emergency of international concern; four diseases must always be notified, even as a single case: smallpox, polio caused by wild poliovirus, human influenza caused by a new subtype, and SARS. WHO also recognizes health care-associated (nosocomial) infections as a worldwide patient-safety problem affecting hundreds of millions of patients. Patients at highest risk include those in intensive care (especially newborns in neonatal ICUs, whose immune systems are immature and who have catheters, ventilators and long stays), surgical patients, and anyone with invasive devices or weakened immunity.
WHO defines health as a state of complete physical, mental and social well-being, not merely the absence of disease or infirmity, so a definition that leaves out mental health is wrong. "Disease X" is WHO's placeholder name for an unknown pathogen that could cause a future epidemic.
CDC's Ten Great Public Health Achievements of the 20th-century United States (1999) are a common list question: vaccination; motor-vehicle safety; safer workplaces; control of infectious diseases; decline in deaths from heart disease and stroke; safer and healthier foods; healthier mothers and babies; family planning; fluoridation of drinking water; and recognition of tobacco use as a health hazard. Its 2011 follow-up list for 2001–2010 named vaccine-preventable diseases, prevention and control of infectious diseases, tobacco control, maternal and infant health, motor-vehicle safety, cardiovascular disease prevention, occupational safety, cancer prevention, childhood lead poisoning prevention, and public health preparedness and response. CDC's 2010 "Winnable Battles" were food safety, health care-associated infections, HIV, motor-vehicle injuries, nutrition, physical activity and obesity, teen pregnancy, and tobacco.
The leading causes of death worldwide, according to WHO, are ischemic heart disease and stroke. In the United States the leading causes are heart disease and cancer, followed by unintentional injuries; most of the top ten are chronic, noninfectious diseases. That shift is the epidemiologic transition (see Noninfectious causes).
A short history
History questions are usually "who did this?" or "what is this person called?" Two names get mixed up: Graunt (1662) first analyzed the death counts in the Bills of Mortality, so he is the founder of vital statistics and demography; Farr (1839 on) built the national system of vital statistics, cause-of-death classification and routine analysis, so he is the father of modern vital statistics and surveillance and a founder of medical statistics. Learn the name, the date to the decade, the disease and the method, because the method is what made each person matter to epidemiology. The nicknames in the table are the ones tests use; some are shared (Snow and Farr are both called a father of modern epidemiology or of surveillance in different sources), so read the description in the question, not just the title.
ReferencePeople and milestones in the history of epidemiology· 46 rows
No rows match.
| Who | When | Contribution | Called |
|---|---|---|---|
| Hippocrates | ~400 BCE | Explained disease by environment and behavior, not the supernatural (Airs, Waters, Places); used the words endemic and epidemic | Father of medicine; first epidemiologist |
| Girolamo Fracastoro | 1546 | De Contagione: proposed that tiny "seeds" spread disease by direct contact, fomites and through the air, an early germ theory | — |
| Thomas Sydenham | 1660s–1670s | Careful clinical description and classification of diseases (Observationes Medicae) | The English Hippocrates |
| John Graunt | 1662 | Analyzed London's weekly Bills of Mortality: counted births and deaths by cause and season, noticed excess deaths in epidemics, built the first life table | Father of demography; founder of vital statistics |
| Antonie van Leeuwenhoek | 1670s | Built single-lens microscopes; first to describe bacteria and protozoa ("animalcules"); gave the first accurate description of red blood cells (1674) | Father of microbiology |
| Variolation in England | 1721 | Deliberate infection with material from smallpox sores to cause a milder case; introduced to England by Lady Mary Wortley Montagu (1721); replaced by Jenner's safer method. Modern smallpox vaccine uses vaccinia virus, a related poxvirus, not cowpox | — |
| James Lind | 1747 | Compared six scurvy treatments in 12 sailors; citrus fruit cured scurvy (A Treatise of the Scurvy, 1753) | Early controlled clinical trial |
| Benjamin Jesty | 1774 | Farmer who deliberately inoculated his family with cowpox, before Jenner | — |
| Percivall Pott | 1775 | Linked scrotal cancer in chimney sweeps to soot: first occupational cause of cancer | — |
| Edward Jenner | 1796 | Inoculated James Phipps with cowpox from milkmaid Sarah Nelmes, then showed he resisted smallpox: the first vaccine (vacca = cow) | Father of immunology / vaccination |
| Pierre Louis | 1830s | "Numerical method": counted outcomes to show bloodletting did not help pneumonia | — |
| William Farr | from 1839 | Built England's system of vital statistics and cause-of-death classification; his published cholera mortality data by water company were used by Snow | Father of modern vital statistics and surveillance |
| Peter Panum | 1846 | Measles on the Faroe Islands: described the incubation period and lifelong immunity | — |
| Ignaz Semmelweis | 1847 | In Vienna, doctors coming from autopsies carried "cadaverous particles" to mothers; handwashing in chlorinated lime cut deaths from puerperal (childbed) fever | Savior of mothers; pioneer of hand hygiene |
| John Snow | 1849–1854 | Mapped cholera deaths around the Broad Street pump (had the handle removed) and compared customers of two water companies (Southwark & Vauxhall vs Lambeth): waterborne cholera, decades before the germ was accepted | Father of (modern / field) epidemiology |
| Florence Nightingale | 1850s | Crimean War nurse; polar-area ("coxcomb") diagrams showed soldiers died mainly of preventable disease; founded a nursing school | Founder of modern nursing |
| Mary Seacole | 1850s | Ran the "British Hotel" caring for soldiers in the Crimean War | — |
| William Budd | 1850s–1870s | Showed typhoid spreads through contaminated water and feces | — |
| Louis Pasteur | 1850s–1880s | Germ theory of disease; disproved spontaneous generation (swan-neck flasks); pasteurization; vaccines for anthrax (1881) and rabies (1885) | Father of bacteriology (with Koch); father of germ theory |
| Joseph Lister | 1867 | Antiseptic surgery with carbolic acid (phenol), applying Pasteur's germ theory | Father of antiseptic surgery |
| Robert Koch | 1876–1884 | Identified the bacteria of anthrax (1876), tuberculosis (1882) and cholera (1883); Koch's postulates (Henle–Koch) | Father of bacteriology / microbiology |
| Friedrich Loeffler (with Paul Frosch) | 1884; 1898 | Koch's associate; isolated the diphtheria bacterium (1884) and showed foot-and-mouth disease is caused by a filterable agent, the first animal virus discovered (1898) | — |
| Dmitri Ivanovsky and Martinus Beijerinck | 1892; 1898 | Showed tobacco mosaic disease passes through bacteria-proof filters; Beijerinck called the agent a "virus" | Founders of virology |
| Ronald Ross | 1897 | Showed malaria is transmitted by mosquitoes | — |
| Walter Reed | 1900 | Yellow fever is transmitted by mosquitoes (Cuba) | — |
| Mary Mallon ("Typhoid Mary") | 1906–1915 | Healthy chronic carrier of typhoid who infected people as a cook; traced by sanitary engineer George Soper | Classic chronic carrier |
| Joseph Goldberger | 1914–1920s | Showed pellagra is a dietary deficiency, not an infection | — |
| Janet Lane-Claypon | 1926 | Breast cancer and reproductive history: an early case-control study; also an early cohort study of infant feeding (1912) | Pioneer of case-control and cohort designs |
| Kermack and McKendrick | 1927 | SIR (susceptible–infectious–recovered) mathematical model of epidemics | — |
| Alexander Fleming | 1928 | Discovered penicillin, the first antibiotic | — |
| Joseph Mountin | 1946 | Founded CDC (Communicable Disease Center, Atlanta) | Founder of CDC |
| Framingham Heart Study | 1948– | Prospective cohort in Framingham, Massachusetts, that identified cardiovascular risk factors (smoking, high blood pressure, cholesterol) | — |
| Medical Research Council streptomycin trial | 1948 | Streptomycin for tuberculosis: usually cited as the first modern randomized controlled trial (designed by Bradford Hill) | — |
| Doll and Hill | 1950 and 1951– | Case-control study, then the British Doctors Study (prospective cohort) linking smoking to lung cancer | — |
| Alexander Langmuir | 1951 | Founded CDC's Epidemic Intelligence Service and modern disease surveillance | — |
| Jonas Salk | 1954–1955 | Inactivated (injected) polio vaccine (IPV), developed at the University of Pittsburgh; the 1954 field trial with about 1.8 million children was the largest public health experiment | — |
| Mantel and Haenszel | 1959 | Method for combining stratified 2 × 2 tables in case-control studies (Mantel–Haenszel odds ratio) | — |
| Albert Sabin | 1960s | Oral live-attenuated polio vaccine (OPV) | — |
| Maurice Hilleman | 1960s–1980s | Developed more than 40 vaccines, including measles, mumps (Jeryl Lynn strain) and the MMR combination | — |
| Austin Bradford Hill | 1965 | Criteria for judging causation from an association | — |
| D. A. Henderson | 1967–1977 | Directed WHO's smallpox eradication campaign (surveillance and ring vaccination) | — |
| Abdel Omran | 1971 | Described the epidemiologic transition from infectious to chronic disease | — |
| Alfred Evans | 1976 | Evans's postulates, updating Koch for epidemiology and immunology | — |
| Kenneth Rothman | 1976 | Sufficient–component cause ("causal pie") model | — |
| Smallpox eradication | last natural case 1977 (Somalia); declared 1980 | First human disease eradicated; samples remain only at CDC (Atlanta) and VECTOR (Russia) | — |
| Julie Gerberding | 2002 | First woman to direct CDC | — |

ReferenceNotable outbreaks and events tests mention· 18 rows
No rows match.
| Event | Year | What happened and why it matters |
|---|---|---|
| Broad Street cholera | 1854 | Snow's spot map and pump-handle removal: waterborne spread |
| "Spanish" influenza pandemic | 1918–1919 | H1N1; about a third of the world's people infected and tens of millions of deaths; the same subtype (H1N1) caused the 2009 pandemic |
| Legionnaires' disease, Philadelphia | 1976 | Pneumonia at an American Legion convention; Legionella bacteria in the hotel's air-conditioning system, newly identified |
| Jack in the Box E. coli O157:H7 | 1992–1993 | Undercooked hamburgers in western states; four children died; led to stricter cooking rules and to PulseNet |
| Milwaukee cryptosporidiosis | 1993 | Contaminated city water; about 400,000 ill, the largest U.S. waterborne outbreak |
| SARS | 2002–2003 | New coronavirus from China spread by travel to about 30 countries; controlled by isolation, quarantine and contact tracing |
| H1N1 influenza pandemic | 2009 | Novel swine-origin influenza; WHO declared a pandemic |
| Peanut Corporation of America Salmonella | 2008–2009 | Contaminated peanut butter and paste; hundreds ill in many states; criminal convictions |
| Jensen Farms cantaloupe Listeria | 2011 | One of the deadliest U.S. foodborne outbreaks |
| Flint water crisis | 2014– | Change of water source corroded pipes: lead in drinking water and a Legionnaires' outbreak |
| West Africa Ebola epidemic | 2014–2016 | Over 28,000 cases; contact tracing, safe burials and isolation units |
| Disneyland measles | 2014–2015 | Outbreak starting at a California theme park spread mainly among unvaccinated people; led California to end non-medical vaccine exemptions |
| Chipotle outbreaks | 2015 | Several E. coli, norovirus and Salmonella outbreaks; a norovirus outbreak in Boston traced to an ill employee |
| Zika epidemic | 2015–2016 | Mosquito-borne virus in the Americas; congenital microcephaly (vertical transmission) |
| Romaine lettuce E. coli O157:H7 | 2018 | Multistate outbreaks traced to growing regions by whole-genome sequencing |
| EVALI | 2019 | Lung injury from vaping, mostly THC products containing vitamin E acetate; an outbreak with a chemical cause |
| COVID-19 | 2019– | SARS-CoV-2; WHO declared a pandemic on 11 March 2020 |
| Mpox | 2022 | Global outbreak spread mainly through close sexual contact |
Natural history and spectrum of disease
The natural history of disease is the course an illness takes in one person when nothing interrupts it:
- Susceptibility: the person has not yet been exposed (or not yet affected) but is at risk.
- Subclinical disease: after exposure, pathologic changes begin without symptoms. For infections this gap is the incubation period; for chronic diseases the equivalent is the latency period.
- Clinical disease: symptoms appear; this is usually when diagnosis happens.
- Outcome: recovery, disability or death.
Tests name the four stages exactly: stage of susceptibility, stage of subclinical disease, stage of clinical disease, and stage of recovery, disability or death. Two landmarks sit between them: exposure (end of susceptibility) and the onset of symptoms (start of clinical disease); usual time of diagnosis falls in the clinical stage. Pathologic changes begin in the subclinical stage, which is why screening (secondary prevention) targets that stage: a test can find the disease before symptoms appear. Primary prevention acts during susceptibility, before exposure; tertiary prevention acts once clinical disease is established and during recovery or disability.
Incubation vs latency. In CDC's usage, the incubation period is the time from exposure (infection) to the onset of symptoms for an infectious disease, and the latency period is the equivalent interval for a chronic or noninfectious disease (decades between asbestos exposure and mesothelioma). Infectious-disease modelers use latent period differently: the time from infection until the person becomes infectious. If the latent period is shorter than the incubation period, people transmit before they feel sick (as with influenza and COVID-19), which makes isolation of symptomatic people less effective. Read which meaning the question intends.

Exposure windows. Knowing the maximum incubation period tells you how far back to ask about exposures (travel, meals, contacts) and how long to quarantine or monitor exposed people: someone still well after the longest incubation period since exposure is unlikely to have been infected.
What changes the incubation period. It varies from person to person because of the dose (a larger inoculum usually means a shorter incubation), the route of entry (inhaled or injected agents can act faster than swallowed ones), the host's immune status (prior immunity or prophylaxis can lengthen it or prevent disease) and the agent's own growth rate. Because of this spread, incubation periods in an outbreak form a right-skewed (roughly log-normal) distribution, which is why the median is reported. Treatment after symptoms begin does not change the incubation period.
The period of communicability (communicable or infectious period) is the time during which an infected person can transmit the agent. It may start before symptoms and continue after recovery. For many infections, people are most contagious around the end of the incubation period and the prodromal and early acute stage, when shedding is high but the illness may not yet be recognized (measles spreads from about four days before to four days after the rash appears; influenza spreads most in the first days of illness).
Stages of a clinical infection. Within the clinical stage, many infections follow a recognizable course:
| Stage | What happens |
|---|---|
| Incubation | No signs or symptoms; the agent is multiplying |
| Prodromal | Early, vague, nonspecific symptoms (malaise, mild fever, headache): the prodrome |
| Illness (acute) | Most severe signs and symptoms; the peak is called the fastigium |
| Decline (defervescence) | Symptoms subside; fever falls; risk of secondary infections |
| Convalescence | Recovery to the pre-illness state; some people remain convalescent carriers |
The spectrum of disease is the range of severity across people with the same infection or condition, from inapparent infection to death. Many infections, such as polio, hepatitis A and influenza, are often mild or silent, so reported cases are only the tip of an iceberg: the iceberg phenomenon (or iceberg concept) is the term for this hidden mass of unrecognized, subclinical or unreported cases. It matters because surveillance counts only the visible tip, so the true burden and the infectivity of an agent are underestimated. Spectrum can also come from the host: for genetic disorders, varying penetrance and expressivity, different mutations and environmental factors make some people far sicker than others.
People without symptoms can still be carriers: incubatory carriers (infectious before symptoms appear), convalescent carriers (still shedding after recovery), chronic carriers (shedding for months or years, like Typhoid Mary) and asymptomatic (inapparent or healthy) carriers who never become ill. Asymptomatic carriers are a bigger public health problem than sick people because they move about normally and are never isolated; they are also hard to find through contact tracing.
Three properties of an infectious agent are tested often, and each has its own denominator:
Infectious agents in broad terms
The rules ask you to understand infectious causes (bacteria, viruses, fungi, protists, prions) and noninfectious causes (injuries, environmental and occupational exposures, toxic substances) only in broad terms. Know the categories well enough to reason: a prion is a misfolded protein with no nucleic acid, so it is not killed by ordinary sterilization; antibiotics treat bacteria, not viruses; a chemical exposure produces no person-to-person spread.
A pathogen is any microorganism or agent that can cause disease; a parasite lives on or in a host and benefits at the host's expense. The agent classes differ in structure, and the structure decides how they are treated and controlled:
| Agent | What it is | Key traits for reasoning | Treated or controlled with | Examples tests use |
|---|---|---|---|---|
| Bacteria | Single-celled prokaryotes (no nucleus), with a cell wall; some form spores or release toxins | Can grow outside cells, in food or water; many are harmless or helpful | Antibiotics; cooking, pasteurization, chlorination | Cholera (Vibrio cholerae), tuberculosis, Salmonella, E. coli O157:H7, Listeria, plague, Lyme disease, tetanus, pertussis, anthrax |
| Viruses | Genetic material (DNA or RNA) in a protein coat; not cells; much smaller than bacteria | Reproduce only inside host cells; not affected by antibiotics | Vaccines, some antivirals, preventing exposure | Influenza, measles, polio, HIV, hepatitis A/B/C, rabies, Ebola, Zika, dengue, norovirus, COVID-19, chickenpox (varicella) |
| Fungi | Eukaryotes: yeasts and molds; spread by spores | Often opportunistic, striking people with weak immunity; a fungal infection is a mycosis | Antifungals | Ringworm and athlete's foot (tinea), candidiasis, valley fever (coccidioidomycosis, inhaled spores), histoplasmosis, aspergillosis |
| Protists (protozoa) | Single-celled eukaryotes | Many have complex life cycles with vectors or cysts in water | Antiparasitic drugs; vector control; water filtration | Malaria (Plasmodium), giardiasis, cryptosporidiosis, amebiasis, Chagas disease (Trypanosoma), toxoplasmosis |
| Helminths | Multicellular parasitic worms | Large; eggs or larvae spread through soil, food or water | Antiparasitic drugs; sanitation; cooking meat | Roundworm (Ascaris), hookworm, tapeworm, trichinellosis, schistosomiasis |
| Ectoparasites | Arthropods living on the skin | Spread by close contact or shared items | Topical treatment, washing bedding | Lice, scabies mites |
| Prions | Misfolded proteins with no DNA or RNA that make normal proteins misfold | Resist heat, radiation and ordinary disinfection; very long incubation; attack the brain | No treatment; prevent exposure (remove infected tissue from the food chain) | Creutzfeldt–Jakob disease (CJD), variant CJD and mad cow disease (BSE), kuru, fatal familial insomnia, chronic wasting disease |
Bacteria cause harm partly through toxins. Exotoxins are proteins secreted by living bacteria (botulinum toxin, tetanus toxin, cholera toxin); a toxoid is an exotoxin inactivated to make a vaccine. Endotoxin is part of the outer membrane of Gram-negative bacteria and is released when the cells break apart. Bacteremia means bacteria are present in the blood; septicemia means they are multiplying there; sepsis is the body's life-threatening, body-wide response to an infection.
An arbovirus is an arthropod-borne virus spread by mosquitoes or ticks: dengue, Zika, West Nile, yellow fever and chikungunya are examples (rabies is not one; it spreads through bites of mammals).
ReferenceDiseases tests name: agent type and how they spread· 38 rows
The rules say you do not have to memorize which pathogen causes a disease or its symptoms, and a good test supplies that background. Invitational tests still ask "classify this disease by agent type" or "what is the mode of transmission?", so this quick reference covers the diseases that appear most often. Use it to reason about control measures (antibiotics only for bacteria; vector control only for vector-borne disease).
No rows match.
| Disease | Agent type | Main transmission | Reservoir or notes |
|---|---|---|---|
| Cholera | Bacterium (Vibrio cholerae) | Water or food contaminated with feces (fecal–oral) | Humans; brackish water |
| Typhoid fever | Bacterium (Salmonella Typhi) | Fecal–oral, food and water | Humans only; chronic carriers |
| Salmonellosis | Bacterium (nontyphoidal Salmonella) | Food: poultry, eggs, unpasteurized milk, produce | Animals (zoonotic) |
| E. coli O157:H7 (STEC) | Bacterium | Food: undercooked ground beef, raw produce, unpasteurized milk; water | Cattle |
| Listeriosis | Bacterium (Listeria monocytogenes) | Food: deli meats, soft cheese, unpasteurized milk; grows in the refrigerator | Dangerous in pregnancy |
| Botulism | Bacterial toxin (Clostridium botulinum) | Improperly home-canned food (intoxication) | Soil; spores |
| Tetanus | Bacterial toxin (Clostridium tetani) | Spores enter wounds; not person to person | Soil, manure |
| Tuberculosis | Bacterium (Mycobacterium tuberculosis) | Airborne droplet nuclei | Humans |
| Pertussis (whooping cough) | Bacterium | Respiratory droplets | Humans |
| Lyme disease | Bacterium (Borrelia burgdorferi) | Bite of black-legged (deer) tick, Ixodes | White-footed mice and other small mammals; deer feed the adult ticks |
| Rocky Mountain spotted fever | Bacterium (rickettsia) | Tick bite | Ticks, rodents |
| Plague | Bacterium (Yersinia pestis) | Flea bite (bubonic); respiratory droplets (pneumonic) | Rodents |
| Anthrax | Bacterium (Bacillus anthracis) | Contact with or inhaling spores from infected animals or products | Livestock; soil |
| Legionnaires' disease | Bacterium (Legionella) | Inhaling aerosolized water (cooling towers, hot tubs); not person to person | Warm water systems |
| Leprosy (Hansen's disease) | Bacterium (Mycobacterium leprae) | Prolonged close contact | Humans; armadillos |
| Chlamydia, gonorrhea, syphilis | Bacteria | Sexual contact | Humans |
| Measles | Virus | Airborne; among the most contagious diseases | Humans only |
| Influenza | Virus | Respiratory droplets (some airborne), contact | Humans, birds, pigs |
| COVID-19 | Virus (SARS-CoV-2) | Respiratory droplets and aerosols | Probably bats originally |
| Polio | Virus | Fecal–oral | Humans only |
| Hepatitis A | Virus | Fecal–oral, food and water | Humans |
| Hepatitis B and C | Viruses | Blood and body fluids (needles, sex, mother to baby) | Humans |
| HIV/AIDS | Virus | Sex, blood, mother to child (including breastfeeding) | Humans |
| Rabies | Virus | Bite or saliva of infected mammal | Bats, raccoons, skunks, foxes, dogs |
| Norovirus | Virus | Fecal–oral, food, fomites, vomit aerosols | Humans; the leading cause of U.S. foodborne illness and of acute gastroenteritis; peaks in winter (cold-weather survival, indoor crowding); cruise ships, schools |
| Ebola, Marburg | Viruses (filoviruses) | Contact with blood and body fluids | Fruit bats (zoonotic spillover) |
| Dengue, Zika, yellow fever, chikungunya | Viruses (arboviruses) | Aedes mosquito bite; Zika also sexual and mother to fetus | Humans, primates |
| West Nile | Virus (arbovirus) | Culex mosquito bite | Birds |
| Chickenpox (varicella), mumps, rubella | Viruses | Respiratory droplets, airborne (varicella) | Humans |
| Shingles (herpes zoster) | Virus (varicella-zoster) | Not caught from others as shingles: reactivation of latent chickenpox virus; its blisters can give chickenpox to non-immune people | Humans |
| Malaria | Protozoan (Plasmodium) | Bite of female Anopheles mosquito | Humans; mosquito |
| Giardiasis, cryptosporidiosis | Protozoa | Water contaminated with feces (fecal–oral); cysts resist chlorine (Cryptosporidium especially) | Humans, animals |
| Chagas disease | Protozoan (Trypanosoma cruzi) | Feces of triatomine ("kissing") bugs | Animals |
| Toxoplasmosis | Protozoan | Cat feces, undercooked meat | Cats |
| Trichinellosis | Helminth (roundworm) | Undercooked pork or wild game (bear) | Animals |
| Candidiasis | Fungus (yeast) | Overgrowth of normal flora; antibiotics or weak immunity | Humans |
| Valley fever, histoplasmosis | Fungi | Inhaling spores from soil (histoplasmosis: bird and bat droppings) | Soil |
| CJD, vCJD, BSE, scrapie (sheep and goats) | Prions | vCJD from eating BSE-infected beef; CJD mostly sporadic | — |
Food safety basics
Foodborne outbreaks are the most common scenario on Disease Detectives tests, so a few food-safety facts help you reason about causes and controls:
- Foodborne infection vs intoxication. In an infection, living organisms are eaten and multiply in the gut, so incubation is longer (often 12 hours to several days for Salmonella, E. coli and norovirus, and weeks for hepatitis A). In an intoxication, a toxin already formed in the food causes illness, so onset is fast (often 30 minutes to 8 hours for Staphylococcus aureus or Bacillus cereus toxins; botulism is the slow exception). Viruses and parasites cause infections, not intoxications.
- The temperature danger zone is 40–140 °F (4–60 °C), where bacteria multiply fastest. Keep cold food at or below 40 °F and hot food at or above 140 °F; refrigerate leftovers within 2 hours (1 hour above 90 °F).
- Safe minimum internal temperatures (USDA/CDC): whole cuts of beef, pork, veal and lamb 145 °F with a 3-minute rest; fish 145 °F; ground meats 160 °F; poultry (whole or ground), leftovers and casseroles 165 °F. Ground beef needs more heat than a steak because grinding mixes surface bacteria into the middle.
- CDC's four steps to food safety: Clean, Separate, Cook, Chill (some versions add Report suspected illness).
- FAT TOM lists what bacteria need to grow: Food, Acidity, Time, Temperature, Oxygen, Moisture.
- Cross-contamination (raw chicken juices on a cutting board used for salad) and ill food handlers who do not wash their hands are the usual failures. A critical control point in a food-safety (HACCP) plan is a step where a control (cooking temperature, handwashing, chilling) can prevent or eliminate a hazard.
- Higher-risk groups for foodborne illness are pregnant women, young children, older adults and people with weakened immune systems or chronic illness.
Noninfectious causes: chronic disease, injury and toxic exposures
Most deaths in the United States now come from noninfectious (noncommunicable) causes: heart disease, cancer, stroke, chronic lung disease, diabetes and injuries. Epidemiology handles them with the same tools, but the "agent" is an exposure or behavior rather than a microbe:
- Chronic diseases develop slowly, last a long time and usually have many risk factors acting together. The big modifiable ones are tobacco use, poor diet, physical inactivity and excessive alcohol use. Obesity is a risk factor for type 2 diabetes, heart disease, stroke and several cancers. An acute disease, by contrast, starts suddenly and lasts a short time.
- Injuries are classed as unintentional (motor-vehicle crashes, falls, drowning, poisoning) or intentional (violence, suicide). In the triad, the agent of an injury is energy (mechanical, thermal, chemical); seat belts, helmets and smoke alarms block it.
- Environmental and occupational exposures include lead (paint, old pipes; harms children's brain development), asbestos (mesothelioma and lung cancer decades later), mercury, air pollution (fine particles, PM2.5), radiation and pesticides. Because these do not spread person to person, an outbreak from a chemical exposure has a common-source (point, continuous or intermittent) epi curve, not a propagated one.
- Toxicology terms: the dose–response relationship (more exposure, more effect); the LD₅₀, the dose that kills half of a test population; and the infectious dose (ID₅₀ for half of those exposed to become infected), the number of organisms needed to cause infection, which varies hugely between agents.
- Epidemiologic transition (Abdel Omran, 1971): as societies develop, the main causes of death shift from infectious disease and famine to chronic, degenerative and human-made diseases, and life expectancy rises. It runs alongside the demographic transition from high birth and death rates to low ones. Later authors added further stages marked by aging, emerging and re-emerging infections and antibiotic resistance.

Determinants of health sit behind all of this. Healthy People 2020 grouped them into five categories: policymaking, social factors, health services, individual behavior, and biology and genetics (other versions list genes and biology, health behaviors, the social environment, the physical environment and health services). At the population level, social and economic conditions (income, education, housing) have the largest influence, which is why the Health Impact Pyramid puts them at its base.
The epidemiologic triad and the chain of infection
The epidemiologic triad says that disease results from the interaction of an agent (a microbe, toxin or physical force), a susceptible host (age, immunity, genetics, nutrition, behavior) and an environment that brings them together (climate, crowding, sanitation, presence of vectors). Every control measure attacks at least one corner: treat or remove the agent, protect the host, or change the environment.
The chain of infection expands the triad into six links, and breaking any link stops transmission:
- Infectious agent.
- Reservoir: where the agent normally lives and multiplies: humans, animals (diseases passed from animals to humans are zoonoses) or the environment (soil, water).
- Portal of exit: respiratory secretions, feces, blood, skin lesions.
- Mode of transmission: direct (skin contact, sexual contact, droplet spray over a short distance) or indirect: airborne (tiny droplet nuclei that stay suspended), vehicle-borne (food, water, blood products, or contaminated objects called fomites) and vector-borne (insects or ticks; mechanical when the agent just rides on the vector, biological when it multiplies or develops inside it).
- Portal of entry: often matches the exit (respiratory to respiratory, fecal–oral).
- Susceptible host.
A few distinctions carry most of the points in this area:
- Droplet vs airborne. Droplets are large (traditionally more than about 5 µm), fall within roughly 1–2 m (3–6 ft), and reach the eyes, nose or mouth directly; this counts as direct transmission (influenza, pertussis, common colds). Droplet nuclei are the dried residue of droplets, smaller than about 5 µm, that stay suspended and travel on air currents; that is airborne (indirect) transmission (measles, tuberculosis, chickenpox). The 5 µm cut-off is a teaching convention; real aerosols form a continuum.
- Vector vs vehicle vs fomite. A vector is a living carrier, usually an arthropod (mosquito, tick, flea, fly). A vehicle is a nonliving intermediary: food, water, blood, air or an object. A fomite is a nonliving object (doorknob, desk, towel, stuffed animal) and is one kind of vehicle. A mechanical vector just carries the agent on its body (a fly with Shigella on its legs); a biological vector is one in which the agent multiplies or develops (an Anopheles mosquito with malaria parasites).
- Horizontal vs vertical. Most transmission is horizontal, person to person. Vertical transmission passes from mother to child across the placenta, during birth or in breast milk (congenital Zika, HIV, hepatitis B, HTLV-1).
- Reservoir vs source. The reservoir is where the agent normally lives and multiplies (brackish river and coastal water for Vibrio cholerae, white-footed mice and other small mammals for Lyme bacteria, humans for measles); the source is where a particular person picked it up (a contaminated well). Water can play either role: for Vibrio cholerae or Legionella, which live and multiply in water, water is the reservoir; for most fecal–oral agents (hepatitis A, norovirus, Giardia), contaminated water is a vehicle (the mode of transmission). Most tests treat drinking water as a vehicle unless the agent's natural habitat is water. A zoonosis has an animal reservoir: rabies, plague, Lyme disease, West Nile virus, anthrax, brucellosis, avian influenza, Ebola (bats) and salmonellosis are common examples. Diseases with only a human reservoir (smallpox, measles, polio) are the candidates for eradication. Transmission can also run the other way: reverse zoonosis (anthroponosis or zooanthroponosis) is spread from humans to animals, such as SARS-CoV-2 passing from people to mink, deer and pets, or human tuberculosis infecting elephants. Vector-borne diseases re-emerge when the environment favors vectors: rapid urbanization with crowding and poor sanitation, discarded tires and containers holding standing water (breeding sites for Aedes), deforestation, climate warming that extends mosquito and tick ranges and seasons, travel and trade, and insecticide resistance. When the reservoir is an animal, control can target the animals: vaccinating dogs against rabies, dropping oral rabies vaccine baits for raccoons, foxes and coyotes, vaccinating poultry or livestock, or culling. Animal vaccination protects people without touching them, but it is costly, must reach enough of a wild population to work, and vaccine baits or culling can affect other species; culling also tends to be unpopular. For a new zoonotic agent, the first priority is to find cases and characterize the outbreak (active case finding, testing animals and people) so that control measures such as culling target the real reservoir.
- Infectious vs contagious vs communicable. Infectious means caused by an agent that invades the body; communicable or contagious means it can pass from one host to another. Tetanus and Legionnaires' disease are infectious but not communicable person to person.
- Testing a vector hypothesis with epidemiology. If mosquitoes or other biting insects spread an infection, cases should occur in every group that is bitten (children and older adults as much as young adults) and should rise with mosquito exposure and season. HIV cases are concentrated in sexually active adults and people who inject drugs, not in children who are bitten just as often, and no excess appears in high-mosquito areas, which is evidence that insects do not transmit HIV (the virus does not survive or replicate in the insect). A study to test a suspected vector would compare bite exposure between cases and controls, or compare age and place patterns of cases with the vector's distribution.
- Host factors that change susceptibility include age, immune status (vaccination, prior infection, HIV, chemotherapy), genetics, nutrition, pregnancy and behavior. In the triad, behaviors are host factors, not a fourth corner.
- Environment in cities. Respiratory infections spread faster in urban settings because of high population density (more contacts per day, raising c in R₀), crowded housing, shared indoor spaces and public transit, and transit hubs such as airports that move infected people quickly between places. Crowding, poor ventilation and poor sanitation are the environmental corner of the triad.
Control measures are often classified by the link they break, and a question may ask which link a measure targets: handwashing, masks, safe food handling and vector control target the mode of transmission (handwashing has its biggest effect there); PPE such as gloves, gowns and respirators blocks the portal of entry (tests file it under transmission or portal of entry, so justify your choice); a mask worn by an ill person ("source control") blocks the portal of exit, while one worn by a healthy person protects the portal of entry; culling infected animals or treating cases targets the reservoir, and vaccination targets the susceptible host. In a hospital, the mode of transmission is usually the easiest link to break.

Vocabulary from the CDC glossary
The rules name the glossary of CDC's Principles of Epidemiology as the vocabulary standard, and matching and fill-in-the-blank vocabulary is the single most common question type on invitational tests. Start with the levels of disease occurrence, the terms students mix up most. They form a scale of how much disease there is compared with what is expected:
| Term | Meaning | Example |
|---|---|---|
| Sporadic | Occurs infrequently and irregularly, with no pattern | A single case of histoplasmosis in a community |
| Endemic | The constant presence or usual prevalence of a disease in a population within an area: the baseline | Colds every winter; a low, predictable number of norovirus cases each semester |
| Hypoendemic | Endemic at a constantly low level | Low-level onchocerciasis in parts of Africa |
| Hyperendemic | Persistently high levels of disease | Dengue with several circulating serotypes in New Delhi |
| Holoendemic | A high level of infection beginning early in life and affecting most of the population, often most intense in children, with adults relatively immune | P. falciparum malaria in parts of sub-Saharan Africa |
| Epidemic | An increase, often sudden, in cases above what is normally expected in that population, place and time | 22 legionellosis cases in 3 weeks where 0–1 per year is usual |
| Outbreak | Same as epidemic, but usually used for a more limited geographic area | Vomiting after taco day at one school |
| Cluster | An aggregation of cases grouped in place and time that are suspected to be greater than expected, even though the expected number may not be known | Several childhood cancers on one street |
| Pandemic | An epidemic that spreads over several countries or continents, usually affecting a large number of people | 1918 and 2009 influenza; COVID-19 (declared 11 March 2020) |
| Syndemic | Two or more epidemics (or health conditions) that interact and worsen each other, driven by shared social conditions | Obesity, diabetes and heart disease; HIV and tuberculosis |
Note that endemic says nothing about the size of the baseline: many textbooks describe it as a disease "always present at a relatively low, steady (usual) rate," which is why "endemic" is usually the answer when the level is ordinary and stable; use hypoendemic or hyperendemic only when the question stresses that the steady level is unusually low or high. Sporadic vs endemic: a single case of a disease that is not regularly present (or a rare, unpredictable case) is sporadic; cases occurring at the usual, predictable level for that place, even if that level is low, are endemic. If a question gives a historical baseline (say, up to 15 cases a year) and one case appears, that is within the expected (endemic) level; if the disease is normally absent but occasionally appears (histoplasmosis outside its endemic river-valley regions, a rare zoonosis), one case is sporadic; if it is a disease that should never occur (smallpox, measles where it has been eliminated, or a new agent), one case can signal an outbreak.
ReferenceEpidemiology vocabulary· 98 rows
Definitions paraphrase the CDC glossary and standard texts. Grouped by theme; use the filter box to find a term.
No rows match.
| Term | Meaning | Group |
|---|---|---|
| Epidemiology | Study of the distribution and determinants of health-related states or events in specified populations, and the application of that study to control health problems | Basics |
| Determinant | Any factor (agent, cause, risk factor, source) that brings about a change in health | Basics |
| Risk factor | An aspect of behavior, environment or inherited trait associated with a higher chance of a health outcome | Basics |
| Risk | The probability that an event (illness, injury, death) will occur within a stated period | Basics |
| Risk perception | A person's or community's subjective judgment of how likely and how serious a hazard is; it often differs from measured risk and drives behavior (vaccine hesitancy, panic over rare events) | Basics |
| Exposure | Having come into contact with a cause of, or possessing a characteristic that is a determinant of, a health problem | Basics |
| Population | All inhabitants of an area, or a defined group of people with a common experience or exposure | Basics |
| Etiology | The cause or origin of a disease | Basics |
| Idiopathic | A disease or condition with no known cause | Basics |
| Morbidity | Any departure from health or well-being; illness (measured by incidence and prevalence) | Basics |
| Mortality | Death; the state of being subject to death (measured by death rates) | Basics |
| Natality | Births in a population (birth rate) | Basics |
| Sequela (sequelae) | A condition that results from an earlier disease or injury (paralysis after polio) | Basics |
| Syndrome | A set of symptoms and signs that occur together | Basics |
| Sign / symptom | A sign is objective, seen by an examiner (fever, rash); a symptom is subjective, reported by the patient (pain, nausea) | Basics |
| Acute / chronic | Acute: sudden onset, short course. Chronic: slow onset, long duration | Basics |
| Fulminant | Developing suddenly and with great severity | Basics |
| Endogenous / exogenous | Arising from within the body (normal flora, genetic) / from outside the body (an environmental agent) | Basics |
| Census | A complete count of a population with its demographic details (age, sex, residence, occupation); supplies denominators for rates | Basics |
| Bacteriophage | A virus that infects bacteria | Transmission |
| Acellular agents | Viruses and prions are not cells; bacteria, fungi, protozoa and helminths are | Transmission |
| Antisepsis / disinfection / sterilization | Antisepsis: killing microbes on living tissue (skin). Disinfection: on objects and surfaces. Sterilization: destroying all microbial life, including spores | Control |
| Case | A person in the population or study group identified as having the disease or condition under study | Cases |
| Case-patient | A person who meets the case definition in an investigation | Cases |
| Primary case | The individual who introduced the disease into the group or population | Cases |
| Index case | The first case that comes to the attention of investigators; not necessarily the primary case | Cases |
| Co-primary cases | Cases that become ill at about the same time as the primary case from the same exposure | Cases |
| Secondary case | A case infected by a primary case | Cases |
| Contact | A person who has been exposed to an infected person or animal or a contaminated environment, giving a chance to acquire the infection | Cases |
| Contact tracing | Finding and following up everyone who had contact with a case, to test, treat, quarantine or vaccinate them | Cases |
| Agent | A factor (microorganism, chemical, physical force) whose presence or absence causes disease | Transmission |
| Pathogen | A microorganism or agent capable of causing disease | Transmission |
| Host | A person or animal that gives sustenance or lodging to an infectious agent | Transmission |
| Reservoir | The habitat where an agent normally lives, grows and multiplies (humans, animals, environment) | Transmission |
| Carrier | A person or animal that harbors an agent without obvious disease and can transmit it (incubatory, convalescent, chronic, asymptomatic) | Transmission |
| Vector | A living intermediary, usually an arthropod, that carries an agent to a host; mechanical or biological | Transmission |
| Vehicle | A nonliving intermediary (food, water, blood, objects) that carries an agent | Transmission |
| Fomite | An inanimate object that can be contaminated and carry an agent (doorknob, towel, desk) | Transmission |
| Droplet nuclei | Dried residue of respiratory droplets (under about 5 µm) that stays airborne | Transmission |
| Zoonosis | An infection or disease transmissible between vertebrate animals and humans | Transmission |
| Epizootic / enzootic / panzootic | Epidemic / endemic / pandemic among animals | Transmission |
| Arbovirus | A virus transmitted by arthropods (mosquitoes, ticks) | Transmission |
| Nosocomial | Acquired in a hospital or health-care setting (now "health care-associated infection") | Transmission |
| Iatrogenic | Caused by medical examination or treatment (a drug reaction, a contaminated procedure) | Transmission |
| Communicable / contagious | Able to spread from one host to another | Transmission |
| Inoculum | The amount of an agent introduced into a host | Transmission |
| Infectious dose | The number of organisms needed to cause infection; it varies widely between agents (as few as 10–100 for Shigella or norovirus, often 1,000 or more for Salmonella), because stomach acid and immune defenses kill most organisms that are swallowed | Transmission |
| Infection vs contamination | Infection: the agent enters and multiplies in a host. Contamination: the agent is present on a surface, object or in food | Transmission |
| Colonization | Organisms living on or in the body without causing disease | Transmission |
| Emerging / re-emerging disease | A newly appeared disease, or one that is coming back or spreading after being controlled | Transmission |
| Infectivity | Proportion of exposed persons who become infected | Agent traits |
| Pathogenicity | Proportion of infected persons who develop clinical disease | Agent traits |
| Virulence | Proportion of clinical cases that are severe or fatal; the severity of disease | Agent traits |
| Serotype | A distinct variant within a species of bacterium or virus, defined by its surface antigens | Agent traits |
| Antigenic drift / shift | Drift: small, gradual mutations in a virus's surface proteins (seasonal flu changes). Shift: an abrupt major change from reassortment, which can cause a pandemic | Agent traits |
| Incubation period | Time from exposure to onset of symptoms (infectious disease) | Natural history |
| Latency period | Time from exposure to onset of disease for a chronic disease; in modeling, time from infection to infectiousness | Natural history |
| Period of communicability | Time during which an infected person can transmit the agent | Natural history |
| Prodrome | Early, nonspecific symptoms before the characteristic illness | Natural history |
| Subclinical / inapparent | Infection or disease with no recognizable signs or symptoms | Natural history |
| Latent infection | An infection that persists in the body without symptoms or active replication and can reactivate later (latent tuberculosis, herpes viruses); different from a subclinical (inapparent, asymptomatic) infection, which is active but causes no symptoms | Natural history |
| Cross-immunity (cross-protection) | Immunity to one agent that also protects against a related agent (cowpox or vaccinia against smallpox; one influenza strain giving partial protection against a related one; one dengue serotype protects against others only briefly, and a later infection with a different serotype raises the risk of severe dengue) | Immunity |
| Iceberg phenomenon | Most cases (subclinical, mild, unreported) are hidden below the visible, diagnosed ones | Natural history |
| Spectrum of disease | The range of severity from inapparent to fatal | Natural history |
| Immunity, active | Resistance produced by the host's own immune response (after infection or vaccination) | Immunity |
| Immunity, passive | Resistance from antibodies made by another person or animal (placenta, breast milk, immune globulin, antitoxin) | Immunity |
| Herd immunity | Resistance of a group to spread of an agent because a high proportion of members are immune | Immunity |
| Antigen / antibody | Antigen: a molecule the immune system recognizes as foreign. Antibody: a protein made by B cells that binds a specific antigen | Immunity |
| Prophylaxis | Treatment given to prevent disease (antibiotics after exposure; post-exposure rabies vaccine) | Control |
| Isolation | Separating ill (infected) persons from others to prevent spread | Control |
| Quarantine | Restricting the movement of exposed but well persons, for up to the longest usual incubation period | Control |
| Cordon sanitaire | Restricting movement into and out of a whole area | Control |
| Social distancing | Reducing contact between people in a community (closing schools, canceling events) | Control |
| Notifiable (reportable) disease | A disease that health providers and labs must report to public health authorities by law | Surveillance |
| Surveillance | Ongoing, systematic collection, analysis and interpretation of health data, with timely dissemination for public health action | Surveillance |
| Line listing | A table with one row per case and columns for key variables | Data |
| Epidemic curve | Histogram of cases by time of onset | Data |
| Spot map | Map with a dot or mark for each case where it lived, worked or was exposed | Data |
| Secular trend | Long-term change in disease frequency over years or decades | Data |
| Seasonality | Change in disease frequency that repeats with the season | Data |
| Case definition | Standard criteria (clinical, plus person, place and time) for deciding whether a person has the condition | Data |
| Attack rate | Incidence proportion during an outbreak: ill ÷ population at risk | Measures |
| Incidence | New cases in a population during a period | Measures |
| Prevalence | All existing cases in a population at a point or during a period | Measures |
| Seroprevalence | Proportion of a population with antibodies to an agent (evidence of past or current infection) | Measures |
| Case-fatality rate | Proportion of people with a disease who die of it | Measures |
| Rate | A measure of how fast events happen, with time in the denominator | Measures |
| Ratio / proportion | Ratio: one quantity divided by another. Proportion: a ratio whose numerator is included in the denominator | Measures |
| Lag time | Delay between an event (onset, diagnosis) and its appearance in surveillance data or reports; it makes the end of an epi curve look falsely low | Measures |
| Lead time | The time by which screening advances diagnosis before symptoms would have appeared | Measures |
| Dose–response | Risk changes as the amount of exposure changes | Causation |
| Necessary cause | A cause that must be present for the disease to occur | Causation |
| Sufficient cause | A set of factors whose presence always produces the disease | Causation |
| Confounding | Distortion of an exposure–outcome association by a third factor linked to both | Study design |
| Bias | Systematic error that leads to an incorrect estimate of an association | Study design |
| Null hypothesis | The assumption that there is no association (RR or OR = 1), which a statistical test tries to reject | Study design |
| Placebo | An inactive treatment given to a control group so that participants cannot tell which group they are in | Study design |
| Placebo effect | Improvement because a person believes they are being treated | Study design |
Surveillance
Public health surveillance is the ongoing, systematic collection, analysis and interpretation of health data, closely linked to getting those results to the people who can act on them. It establishes what is normal so departures stand out, and it tracks trends, measures disease burden, evaluates programs and sets priorities.
Learn the definition word for word, because fill-in-the-blank questions ask for "ongoing, systematic." Its uses, as a list: detect outbreaks and epidemics early; monitor trends and long-term patterns; estimate the size of a health problem; identify high-risk groups; describe the natural history of a disease; generate hypotheses and stimulate research; evaluate control and prevention measures; and guide policy and planning. Surveillance does not treat individual patients or provide long-term care. Taken together, the surveillance cycle provides the framework for public health action: it detects the problem, guides the investigation and the choice of interventions, and then measures whether they worked. Federal, state and local health agencies all run surveillance; most routine reports go from clinicians and laboratories to the local or state health department, which forwards data to CDC.
Most surveillance counts newly reported cases, so it tracks incidence over time. A rise in reported cases can be an artifact rather than a real increase: a new or more sensitive test, a changed case definition, a new reporting requirement or awareness campaign, more doctors or better access to care, a new surveillance system, or a growing population. Rule these out before declaring an outbreak.
The 5-step surveillance process
The surveillance cycle is taught as five steps:
- Data collection: case reports from clinicians and laboratories, death certificates, hospital records, registries, surveys.
- Data analysis: organize by person, place and time; compute rates; compare with the baseline.
- Data interpretation: is the change real, or an artifact of a new test, a new case definition or better reporting?
- Data dissemination: send results to those who need them, for example in CDC's Morbidity and Mortality Weekly Report or WHO's Weekly Epidemiological Record.
- Link to action: use the findings to start control measures, change policy or allocate resources, then keep watching to evaluate the result.
A typical question describes an activity and asks which step it is. Making epi curves, maps and rate tables is analysis; deciding whether a rise is real is interpretation; publishing incidence data is dissemination; a health department closing a contaminated pool or recommending social distancing because of the numbers is the link to action.
Notifiable and reportable diseases
A notifiable (or reportable) disease is one that clinicians and laboratories must report to public health authorities. Reporting is required by state law, and each state health department decides its own list. CDC and the Council of State and Territorial Epidemiologists (CSTE) agree on a list of nationally notifiable conditions, which states then report to CDC voluntarily through the National Notifiable Diseases Surveillance System (NNDSS). Examples include measles, hepatitis A and B, salmonellosis, shigellosis, Legionnaires' disease, Lyme disease, tuberculosis, pertussis, botulism, anthrax, rabies and novel influenza A infections. (Ordinary seasonal influenza in adults is not individually notifiable; influenza-associated deaths in children are.) A provider who diagnoses a reportable disease such as shigellosis reports it to the local health department, which passes it to the state.
ReferenceU.S. surveillance systems and data sources tests name· 14 rows
No rows match.
| Name | What it tracks |
|---|---|
| NNDSS (National Notifiable Diseases Surveillance System) | Cases of nationally notifiable diseases reported by states to CDC |
| NEDSS (National Electronic Disease Surveillance System) | Standards and software for electronic reporting of notifiable disease data |
| MMWR (Morbidity and Mortality Weekly Report) | CDC's weekly publication: outbreak reports and surveillance summaries; until 2017 it also printed the weekly tables of notifiable-disease cases reported by states (passively reported data), which now appear on CDC's NNDSS website (dissemination) |
| PulseNet | DNA fingerprints (now whole genomes) of foodborne bacteria from public health labs |
| FoodNet | Active, population-based surveillance for laboratory-confirmed foodborne infections in selected sites |
| VAERS (Vaccine Adverse Event Reporting System) | Passive reports of possible vaccine side effects (CDC and FDA) |
| BRFSS (Behavioral Risk Factor Surveillance System) | Telephone survey of adults' health behaviors (smoking, exercise, seat belts) |
| YRBSS (Youth Risk Behavior Surveillance System) | Survey of high-school students' health behaviors |
| NHANES (National Health and Nutrition Examination Survey) | Interviews plus physical exams and lab tests on a national sample |
| NVSS (National Vital Statistics System) | Births and deaths from certificates (vital statistics) |
| NHSN (National Healthcare Safety Network) | Health care-associated (nosocomial) infections |
| NSSP / BioSense | Syndromic surveillance from emergency-department visits |
| ILINet, FluView | Sentinel outpatient reports of influenza-like illness |
| Disease registries | Ongoing records of all cases of a condition, such as cancer registries |
Types of surveillance
| Type | How it works | Strength | Weakness |
|---|---|---|---|
| Passive | Providers and labs report notifiable conditions on their own initiative | Cheap; covers the whole jurisdiction | Underreporting; slow |
| Active | Health department staff contact providers or search records for cases | More complete and accurate | Costly; used in outbreaks or for priority diseases |
| Sentinel | Selected providers or sites chosen to represent an area or group report | High-quality trend data | Not population-wide; may be unrepresentative |
| Syndromic | Tracks symptom patterns before diagnosis: emergency-department complaints, pharmacy sales, school absences | Early warning | Nonspecific; false alarms |
How to classify a scenario: if the health department waits for reports, it is passive (a hospital sending its monthly case counts, doctors reporting Lyme disease, NNDSS reporting). If the health department goes looking (phones clinics daily during an outbreak, visits hospitals to review records, sends field teams to collect data after a chemical leak, traps and tests mosquitoes or sandflies), it is active. If a chosen subset of hospitals, clinics or cities reports, it is sentinel. Sentinel surveillance can also watch sentinel events (a single case of a preventable disease or death that signals a system failure, such as a case of measles or a child's death from a preventable cause), sentinel populations (such as blood donors or pregnant women tested for HIV) or sentinel animals (dead birds or sentinel chicken flocks for West Nile virus). If the data are pre-diagnostic indicators (over-the-counter medicine sales, school or work absences, emergency-department chief complaints, internet searches, ambulance calls), it is syndromic. Active surveillance is the most resource-intensive; passive has the greatest underreporting. Because sentinel sites report consistent, high-quality data over time, sentinel surveillance is well suited to tracking trends and evaluating programs such as a vaccination campaign (for example, watching influenza-like illness or a vaccine-preventable disease at the same clinics before and after the campaign). The National Outbreak Reporting System (NORS) is CDC's system through which health departments report foodborne, waterborne and other enteric outbreaks (spread person-to-person, by animal contact or from the environment), rather than single cases.
Other labels you may meet: laboratory-based surveillance (lab results, such as PulseNet), event-based surveillance (unstructured reports such as news stories and rumors), integrated surveillance (combining several systems, for example case reports plus syndromic data plus school absences), behavioral surveillance (risk behaviors, such as BRFSS), categorical surveillance (separate systems for each disease or program, which can be fragmented and duplicate effort), and surveys and registries. Medical (occupational) surveillance follows a group of workers with a known exposure (lead smelter workers, health care workers exposed to tuberculosis) with periodic exams and tests to detect early effects. Surveillance can also be routine (continuous, ongoing reporting, as for notifiable diseases) or periodic (repeated surveys at intervals, such as an annual serosurvey or BRFSS), and population-based (covering a whole jurisdiction) or facility-based (data from health facilities such as hospitals or clinics).
Attributes of a good surveillance system
CDC's guidelines for evaluating surveillance systems list nine attributes. Simplicity (easy to run), flexibility (adapts to new needs), data quality (complete, valid data), acceptability (people and organizations are willing to take part), sensitivity (the proportion of true cases the system detects, or its ability to detect outbreaks; the same idea as a test's sensitivity in Screening tests), predictive value positive (the proportion of reported cases that really have the condition), representativeness (describes the whole population accurately over time), timeliness (speed between steps) and stability (reliable and available when needed).
Measuring disease frequency
Every calculation in this event is one of three kinds of fraction:
- Ratio: one quantity divided by another; numerator and denominator may be unrelated (male cases : female cases = 3 : 2).
- Proportion: a ratio in which the numerator is part of the denominator, usually written as a percent (40% of cases were children).
- Rate: a measure of how fast events happen, with time built into the denominator (cases per 1,000 person-years). In practice many "rates" in epidemiology, such as the attack rate, are really proportions over a stated period.
Classification questions ("is this a rate, a ratio, a proportion or none?") follow CDC's usage:
| Measure | Strictly, it is a… | Why |
|---|---|---|
| Relative risk, odds ratio, rate ratio | Ratio | One measure divided by another; numerator not part of denominator |
| Sex ratio, maternal mortality ratio, death-to-case ratio | Ratio | Numerator is not a subset of the denominator (maternal deaths ÷ live births) |
| Prevalence, attack rate, case-fatality rate, proportionate mortality, sensitivity, specificity, PPV | Proportion | Numerator is part of the denominator; no time in the denominator (despite "rate" in some names) |
| Incidence rate (incidence density), person-time rates | Rate | Time is in the denominator |
| Mortality rate, birth rate, infant mortality rate | Treated as rates | Events in a period per mid-period population (or per live births) |
ReferenceMortality, morbidity and natality measures· 15 rows
All are for a stated period, usually one year. "Mid-year" population estimates the average population at risk.
No rows match.
| Measure | Numerator | Denominator | Usual 10ⁿ |
|---|---|---|---|
| Crude death (mortality) rate | All deaths | Mid-year population | per 1,000 or 100,000 |
| Cause-specific mortality rate | Deaths from one cause | Mid-year population | per 100,000 |
| Age-specific mortality rate | Deaths in an age group | Mid-year population of that age group | per 100,000 |
| Sex-specific mortality rate | Deaths in one sex | Mid-year population of that sex | per 100,000 |
| Proportionate mortality | Deaths from one cause | All deaths (same period) | percent |
| Case-fatality rate | Deaths from a disease | People with that disease | percent |
| Death-to-case ratio | Deaths from a disease in a period | New cases of that disease in the same period | — |
| Infant mortality rate | Deaths under 1 year | Live births | per 1,000 live births |
| Neonatal mortality rate | Deaths under 28 days | Live births | per 1,000 live births |
| Postneonatal mortality rate | Deaths from 28 days to under 1 year | Live births | per 1,000 live births |
| Maternal mortality ratio | Deaths from pregnancy-related causes | Live births | per 100,000 live births |
| Crude birth rate (natality) | Live births | Mid-year population | per 1,000 |
| General fertility rate | Live births | Women aged 15–44 | per 1,000 |
| Morbidity rate (incidence) | New cases | Population at risk | per 1,000 or 100,000 |
| Years of potential life lost (YPLL) | Sum over deaths before a set age (often 65 or 75) of (that age − age at death) | — | years; YPLL rate per 1,000 people under that age |
Read prevalence and incidence together. High prevalence with low incidence means a long-lasting (chronic) disease that people live with for years; high incidence with low prevalence means a short illness that is quickly cured or quickly fatal. Prevalence rises with new cases, immigration of cases and longer survival; it falls with cures, deaths and emigration of cases. Screening that finds many mild, long-lasting cases inflates prevalence. Prevalence is not a measure of risk, because it mixes in how long people stay sick; incidence (attack rate, incidence proportion) is the measure of risk. And for a chronic disease, prevalence can fall even while incidence stays positive, if enough people die or recover.
Population health status indicators summarize a whole population's health rather than an exposure–disease link: life expectancy, infant mortality rate (often called the best single indicator of a society's health), maternal mortality, crude and age-adjusted death rates, YPLL, disability-adjusted life years (DALYs, years of healthy life lost to illness, disability or early death), and healthy (health-adjusted) life expectancy (HALE, the average number of years a person can expect to live in full health, discounting years lived with illness or disability). RR and OR are measures of association, not health indicators. Infant mortality is far higher in low-income countries because of limited prenatal and obstetric care, low birth weight and prematurity, poor maternal nutrition, unsafe water and sanitation (diarrheal disease), infections such as pneumonia and malaria, and low vaccination coverage.
Case-fatality rates are often biased. Early in an outbreak, mild and asymptomatic cases are missed (the iceberg), which shrinks the denominator and makes the CFR look too high; deaths that occur after the count is taken are missed, which makes it look too low. More testing usually lowers the reported CFR. A high hospitalization proportion (hospitalized ÷ cases) similarly signals a severe illness or a vulnerable population and a burden on the health system, but it may also mean mild cases were never diagnosed, so the proportion is inflated; either way it argues for prevention aimed at high-risk groups and for active case finding. The infection fatality rate uses all infections, including undiagnosed ones, as the denominator.
Crude, specific and adjusted rates
A crude rate describes a whole population. A specific rate describes one subgroup (age-specific, sex-specific, cause-specific). Comparing crude rates between populations with different age structures can mislead, because older populations die at higher rates regardless of anything else. An age-adjusted rate removes that difference. In direct standardization, you apply each population's age-specific rates to the same standard population and compare the resulting summary rates. Division C covers adjusted rates at every level.
Adjusted rates are fictional summary numbers made for comparison; they do not tell you how many people actually died. That matters for a common trick question: if a country's age-adjusted cancer death rate is flat or falling while the population is growing and aging, the number of cancer deaths and the crude rate can still rise, because there are more older people. Age adjustment is needed whenever the age distributions of the populations (or of one population in two years) differ. The other approach, indirect standardization, applies a standard population's age-specific rates to the study population to get the expected number of deaths; the standardized mortality ratio (SMR) = observed deaths ÷ expected deaths, and an SMR above 1 means more deaths than expected.
Patterns and trends in data
Tests show you graphs and ask you to describe them. Time patterns include a secular trend (long-term change over years or decades, such as rising obesity), seasonality (influenza in winter, tick-borne disease in summer), cyclic patterns over several years, and the short-term spike of an outbreak. Choose the right display: a histogram (touching bars) for a continuous variable such as onset time, which is what an epi curve is; a bar chart for categories; a line graph for trends over time; a semilogarithmic graph to compare rates of change; a spot map for individual cases; and an area (choropleth) map for rates by region, which adjusts for population size. When summarizing a distribution, remember that the mean is pulled by outliers while the median is not; incubation periods are usually skewed, so the median is often reported.
| Display | Use it for | Notes |
|---|---|---|
| Table / line listing | Exact values; one row per case | Starting point for every other display |
| Histogram | Frequency of a continuous variable (onset time, age) | Bars touch; the epi curve is a histogram |
| Frequency polygon | Same data as a histogram | Points at the midpoints of the histogram's intervals, joined by straight lines |
| Bar chart | Counts or rates in categories (sex, county, food item) | Bars separated; can be grouped or stacked (subdivided by color or shading) |
| Pie chart | Parts of a whole at one time | Hard to compare slices precisely |
| Line graph | Trends over time (years, weeks) | Arithmetic scale shows absolute change |
| Semilogarithmic graph | Rates of change over time | Equal slopes mean equal percentage change |
| Scatter plot | Relationship between two continuous variables | Upward trend = positive correlation; downward = negative |
| Box plot | Median, quartiles (IQR) and outliers | Good for comparing distributions and spotting skew |
| Spot (dot) map | Location of individual cases | Does not account for population size |
| Area (choropleth) map | Rates by region, shaded | Adjusts for population; hides variation inside each area |
| Forest plot | Point estimates and confidence intervals of several studies (meta-analysis) | Vertical line at RR or OR = 1 |
Seasonality has causes you can name: summer foodborne illness rises because warm temperatures speed bacterial growth and people eat outdoors at picnics and barbecues; vector-borne disease follows mosquito and tick seasons; vectors that live on people, such as body lice (epidemic typhus, trench fever), can transmit year-round, and lice-borne outbreaks peak in cold weather and crowding, when people wear the same clothes for long periods; influenza peaks in winter when people crowd indoors. Norovirus and rotavirus are also winter illnesses in temperate climates: the viruses survive longer in cold conditions and people gather indoors. A disease tied to an animal reservoir (Nipah and fruit bats, for example) follows the animal's seasonal behavior.
Outbreak investigation
The steps
CDC's Principles of Epidemiology lists 13 steps. The order is logical, but in real investigations several happen at once, and control measures start as soon as anything is known.
- Prepare for field work: assemble the team, supplies and contacts; get approvals.
- Establish the existence of an outbreak: compare current cases with the expected baseline; rule out artifacts such as a new test or better reporting. The baseline usually comes from surveillance data for the same weeks or months in previous years; a common rule flags counts above the historical mean plus about two standard deviations.
- Verify the diagnosis: review clinical findings and lab results.
- Construct a working case definition.
- Find cases systematically and record information in a line listing.
- Perform descriptive epidemiology: person, place, time; draw the epi curve.
- Develop hypotheses about source, mode of transmission and exposures.
- Evaluate hypotheses epidemiologically with an analytic study.
- As necessary, reconsider, refine and re-evaluate hypotheses.
- Compare and reconcile with laboratory and environmental studies.
- Implement control and prevention measures.
- Initiate or maintain surveillance.
- Communicate findings.
Descriptive epidemiology drives hypothesis generation: a sharp single peak points to one shared exposure; cases clustered in one dormitory point to that building.
Typical actions at each step, which questions describe so that you can name the step:
| Activity in the question | Step (13-step numbering) |
|---|---|
| Assembling the team, reviewing the literature, gathering supplies, notifying state and local contacts | 1. Prepare for field work |
| Comparing the current count with previous weeks or years; checking for reporting artifacts | 2. Establish the existence of an outbreak |
| Reviewing lab results and medical records, talking to patients | 3. Verify the diagnosis |
| Writing the clinical, person, place and time criteria | 4. Case definition |
| Calling hospitals and labs, surveying attendees, building the line list | 5. Find cases (case finding) |
| Drawing the epi curve, spot map, and tables by age and sex | 6. Descriptive epidemiology |
| Proposing that a food, water source or event caused the illness | 7. Develop hypotheses |
| Running a cohort or case-control study, computing RR or OR | 8. Evaluate hypotheses epidemiologically |
| Going back for more cases, a more specific case definition, or a new study when the first one is inconclusive | 9. Reconsider and refine |
| Testing leftover food, water or the environment; matching DNA fingerprints | 10. Lab and environmental studies |
| Recalling a product, closing a restaurant, excluding sick food workers, vaccinating contacts | 11. Control and prevention |
| Watching for new cases after control measures | 12. Surveillance |
| Briefing officials, press releases, writing the report or MMWR article | 13. Communicate findings |
Why investigate at all? To control and prevent further disease (the main reason); to find the source and stop it; to learn about a new disease or new mode of transmission; for research and training; to evaluate existing prevention programs; and because of public, political or legal concern. Investigators collect three kinds of data: clinical (symptoms, lab results), epidemiologic (demographics, exposures, onset times) and environmental (food, water and site samples, inspections).
An investigation is a team effort: epidemiologists, laboratorians, environmental health specialists, clinicians, and communication staff. Information each member gathers must be shared with the whole team, usually through regular meetings and a common line list, so that findings from the lab and the field can be reconciled. Before going to the field, the team agrees on roles, a lead investigator and a spokesperson, and lists the stakeholders to contact (the public health laboratory, local clinicians, the facility involved and the media).
Communicating during an outbreak. CDC's crisis and emergency risk communication principles: be first (release information quickly), be right (accurate, and say what is not yet known), be credible (honest and transparent), express empathy, promote action (tell people what to do) and show respect. One consistent spokesperson and regular updates keep rumors down.
Steps 2 and 3 overlap. Establishing that an outbreak exists and verifying the diagnosis are usually done together. For a familiar disease you compare counts with the baseline first; for a new or unusual agent with no baseline (a novel virus, a disease never seen in the area), verifying the diagnosis comes first, and even a single confirmed case can establish an outbreak.
Case definitions
A case definition is a standard set of criteria for deciding who counts as a case. It combines clinical criteria (symptoms, lab results) with limits of person, place and time: "diarrhea (three or more loose stools in 24 hours) beginning between 4 and 9 May in a student or staff member of Lincoln Middle School." Definitions are often tiered into confirmed (laboratory-confirmed), probable (typical clinical picture, no lab confirmation) and possible or suspect (some features). Early in an investigation a loose definition catches more cases (sensitive); later, a strict definition improves accuracy (specific).
The four components of a case definition are clinical information about the disease, characteristics of the people affected (person), the location (place) and a time period (time). A case definition never includes the suspected exposure, the number of cases, the reservoir, the mode of transmission or control measures. Case definitions can change as an investigation learns more.
Line listings
A line listing is a table with one row per case and columns for identifying information (name or ID, contact details), demographic information (age, sex, residence, occupation), clinical information (onset date and time, symptoms, hospitalization, lab results), risk factor information (exposures relevant to the hypotheses) and reporter information (who reported the case, so investigators can go back for more details or report results). Keep it lean: the columns should be the ones you need to see patterns and build tables, not every detail of each person's life. It is the source for epi curves and 2 × 2 tables.
Epidemic curves
An epi curve is a histogram of cases by date or time of onset. Its shape suggests how the outbreak spread, its time course and where it is heading.
How to draw one. Put time of onset on the x-axis and the number of cases on the y-axis, with touching bars (or one stacked square per case). Choose an interval of about one-quarter to one-third of the average incubation period (hours for a foodborne toxin, days for hepatitis A), start the axis before the first case and run it past the last, and give the graph a title and labeled axes. Shading bars can show subgroups (confirmed vs probable, or by site).
What it tells you: the magnitude of the outbreak; its time trend (still rising or over); the likely pattern of spread (common source vs propagated); outliers (an early case may be the source or the index case; a late case may be secondary or unrelated); and, with a known incubation period, the likely period of exposure. The right-hand end of a curve often looks falsely low because recent cases have not been reported yet (lag time). Epi curves are hard to read when incubation periods vary widely, case numbers are small, there are several exposures, or reporting is irregular.
| Pattern | Shape | Typical example |
|---|---|---|
| Point source (common source, one exposure) | Steep rise, gradual fall; nearly all cases within one incubation period range | Food poisoning after one banquet |
| Continuous common source | Rise, then a plateau that lasts as long as the exposure does | A contaminated well used for weeks |
| Intermittent common source | Irregular peaks with no consistent spacing | A restaurant that sometimes serves a contaminated item |
| Propagated (person to person) | Successive, usually growing peaks about one incubation period apart | Measles in an undervaccinated community |
| Mixed | A point-source peak followed by propagated waves | Norovirus from a meal, then spread within households |
When a question asks for the three main types of epidemic, the expected answer is common source (point or continuous), propagated (progressive) and mixed; some lists instead give point source, continuous common source and propagated.
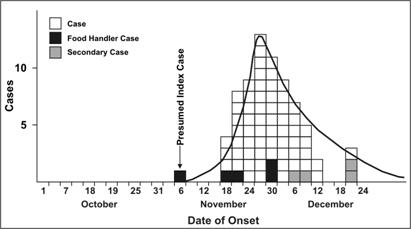

Reading cluster maps and subdivided tables
A cluster map (spot map) places each case where it lived, worked or was exposed; a tight group around one site suggests a common source, as at Broad Street. A subdivided table (stratified table) breaks the attack rate down by a second variable, such as age group, ward or shift, and is how you spot both where the risk concentrates and possible confounding.
Molecular epidemiology: PFGE, SNPs and PulseNet
When the same germ makes people sick in different cities, labs compare the bacteria's DNA to decide whether the cases share a source. Pulsed-field gel electrophoresis (PFGE) cuts the bacterial chromosome with an enzyme that cuts rarely, then separates the large fragments on a gel; the band pattern is a DNA fingerprint. Isolates with indistinguishable patterns probably came from the same source. Whole-genome sequencing compares isolates letter by letter and counts single-nucleotide polymorphisms (SNPs); isolates a few SNPs apart are very closely related. SNP analysis discriminates much more finely than PFGE: it can split isolates that look identical on a gel and can link isolates whose gel patterns differ slightly.
PulseNet is CDC's national network of public health and food regulatory laboratories. Each lab uploads its isolates' fingerprints to a shared database, so cases in different states caused by the same strain are linked into one outbreak even when no single health department sees more than a few cases. PulseNet began with PFGE in 1996 and has since moved to whole-genome sequencing.
How PFGE works, step by step. Bacteria are embedded in agarose plugs and broken open so the chromosome stays intact; a restriction enzyme that recognizes rare sequences cuts it into a dozen or so large fragments; an electric field whose direction alternates (pulses) between angles pushes the fragments through a gel, so that even very large DNA pieces separate by size (smaller fragments travel farther); the gel is stained and the band pattern compared with others. Every gel also runs a reference (standard) strain, usually Salmonella Braenderup H9812, in several lanes as a size marker, so that patterns from different gels and laboratories can be normalized and compared in the PulseNet database. Two isolates whose bands all line up are "indistinguishable." The classic reading rule (Tenover et al., 1995) counts band differences between an outbreak strain and another isolate: 0 differences = indistinguishable (part of the outbreak); 2–3 = closely related (probably part of it); 4–6 = possibly related; 7 or more = unrelated.
Reading SNP results. WGS results come as a SNP distance matrix (the number of single-letter differences between each pair of isolates) or a phylogenetic tree, where isolates on the same short branch cluster are closely related. For many foodborne bacteria, isolates within roughly 0–10 SNPs (or alleles) of each other are treated as likely sharing a recent common source, while isolates dozens or hundreds of SNPs apart are unrelated; the exact cut-off depends on the organism, so tests usually give it.
| PFGE | Whole-genome sequencing (WGS) | |
|---|---|---|
| What it compares | Sizes of large DNA fragments (band patterns) | The full DNA sequence, base by base (SNPs, alleles) |
| Resolution | Moderate: unrelated strains can share a pattern, and one strain can show slightly different patterns | Very high: can tell apart isolates that PFGE calls identical |
| Speed and labor | Several days, labor-intensive, needs careful standardization between labs | Similar turnaround, highly automated; one test replaces several older ones (serotyping, resistance testing) |
| Extra information | Only the fingerprint | Also species, serotype, virulence and antibiotic-resistance genes, and a family tree (phylogenetic tree) of isolates |
| Limits | Cannot by itself say where a strain came from; common patterns create false clusters | Costly equipment and bioinformatics; still needs epidemiologic data to prove a source |
A matching fingerprint shows that cases are probably related, not where they got sick. When a case who clearly fits the outbreak has a negative lab test (a stool culture, for example), possible reasons are intermittent shedding of the organism, a specimen collected too late or after antibiotics, poor specimen handling or transport, a test with low sensitivity, or a different cause of the same symptoms; one negative test does not rule the person out. Investigators still need epidemiologic evidence (interviews, a case-control study, product trace-back) to identify the source. Serotyping (grouping strains by their surface antigens, such as E. coli O157:H7 or Salmonella Enteritidis) is a coarser earlier step that tells you which strain to compare.

Study designs
In an experimental study the investigator assigns the exposure (a vaccine, a drug, an education program). In an observational study the investigator only measures exposures people already have. Experiments give the strongest evidence of cause, but you cannot ethically assign a harmful exposure, so most outbreak and risk-factor work is observational.
| Design | How it works | Main measure | Best for | Weaknesses |
|---|---|---|---|---|
| Randomized controlled trial | Participants randomly assigned to intervention or control, often blinded | Risk ratio; vaccine efficacy | Strongest causal evidence; randomization balances known and unknown confounders | Expensive; impossible for harmful exposures; volunteers may not represent everyone |
| Community (field) trial | Intervention assigned to whole communities or healthy people (fluoridation, a vaccine campaign) | Rate comparison | Prevention programs | Costly; few units; contamination between groups |
| Cohort | Start with exposed and unexposed people free of disease; follow for outcomes. Prospective (forward in time) or retrospective (using past records) | Incidence, risk ratio | Common outcomes; several outcomes of one exposure; small defined outbreak groups (a wedding, a cruise) | Slow and costly if prospective; loss to follow-up; inefficient for rare diseases |
| Case-control | Start with people who have the disease and people who do not; compare past exposures | Odds ratio | Rare diseases; long latency; many exposures at once; outbreaks with no list of everyone exposed | Recall bias; choosing controls is hard; cannot compute incidence or risk |
| Cross-sectional | Measure exposure and disease at one point in time (a survey) | Prevalence, prevalence ratio | Burden of disease; planning; hypothesis generation | Cannot tell which came first |
| Ecological | Unit of analysis is a group (county, country), not a person | Correlation | Quick first look with existing data | Ecological fallacy: a group pattern may not hold for individuals |
Case reports and case series describe one or a few patients with no comparison group; they are how new diseases are first noticed but cannot test a hypothesis. A case report describes a single patient; a case series describes several patients with the same condition, so the two terms are not synonyms.
Descriptive vs analytic. Descriptive studies (case reports, case series, cross-sectional surveys used to measure prevalence, ecological descriptions, surveillance counts) describe who, what, where and when and generate hypotheses. Analytic studies (cohort, case-control, and the analytic use of cross-sectional data) have a comparison group and test why and how. Comparing rates across time periods or places (a time-trend graph, rates by county) is descriptive when it only shows where and when; it becomes an ecological analytic study when it tests a hypothesis about an exposure measured at the group level. Experimental studies (trials) are analytic too.
Which variable defines the groups? This one question sorts most design problems:
| You start with… | Then you… | Design |
|---|---|---|
| Exposure status (exposed and unexposed, all free of disease) | Follow them to see who becomes ill | Cohort (prospective if forward from now; retrospective if using past records, such as a list of everyone at a banquet) |
| Disease status (cases and non-cases) | Look back at their past exposures | Case-control ("effect known, cause unknown") |
| A sample of the population | Measure exposure and disease at the same moment | Cross-sectional ("snapshot"; also called a prevalence study) |
| Groups or places, not individuals | Compare group-level rates and exposures | Ecological |
| Investigator-assigned exposure | Follow both arms | Experimental (RCT, field or community trial) |
ReferenceAdvantages and disadvantages of the main designs· 6 rows
No rows match.
| Design | Advantages | Disadvantages |
|---|---|---|
| Randomized controlled trial | Strongest evidence; randomization balances known and unknown confounders; blinding reduces information bias; establishes temporality | Expensive, slow; ethical limits (cannot assign harmful exposures); volunteers may not represent the population (limits external validity); loss to follow-up |
| Cohort | Establishes temporality; computes incidence and RR directly; good for rare exposures; studies several outcomes of one exposure; less recall bias (prospective) | Expensive and slow (prospective); inefficient for rare diseases or long latency; loss to follow-up (attrition); exposure status can change |
| Case-control | Quick and inexpensive; best for rare diseases and long latency; studies many exposures at once; needs fewer subjects | Recall bias; choosing controls is hard (selection bias); cannot compute incidence or RR (OR only); studies only one outcome; temporality can be unclear |
| Cross-sectional | Fast and cheap; measures prevalence; many exposures and outcomes at once; good for planning and generating hypotheses | Cannot establish temporality; finds long-lasting cases more easily (prevalence–incidence bias); not for rare or short diseases |
| Ecological | Uses existing data; cheap and quick; good first look; compares populations | Ecological fallacy; cannot control confounding at the individual level |
| Case report / series | Recognizes new diseases and unusual presentations | No comparison group; cannot test hypotheses |
Other designs you may be asked to name:
- Nested case-control: cases and controls are drawn from inside an existing cohort, using data collected before disease began.
- Inception cohort: a cohort assembled at a common, early point in the course of a disease (at diagnosis or first symptoms) and followed forward, used to study prognosis without the bias of including only long-term survivors.
- Case-crossover: each case is its own control; exposure just before the event is compared with exposure at other times (useful for short-term triggers such as heavy exertion before a heart attack).
- Crossover trial: each participant receives both the treatment and the control (placebo) in sequence, usually separated by a washout period, so participants act as their own controls, which removes confounding by fixed personal characteristics, including unmeasured ones.
- Quasi-experimental: the investigator assigns or evaluates an intervention but without randomization (before–after studies, a program in one town compared with another).
- Systematic review and meta-analysis: a systematic review collects all studies on a question using explicit methods; a meta-analysis statistically pools their results, often shown on a forest plot. They sit at the top of the usual hierarchy of evidence, followed by RCTs, cohort, case-control, cross-sectional and ecological studies, then case series and reports, and finally expert opinion.
Features of a good experiment. Randomization (each participant has a known, equal chance of each group, which balances confounders), a control group (given a placebo or the current standard treatment), blinding (single-blind: participants do not know their group; double-blind: neither participants nor the investigators assessing them know; triple-blind: data analysts also blinded), standardized procedures, enough participants, and high follow-up. Blinding reduces the placebo effect and observer bias; randomization handles confounding. Because participants in blinded, placebo-controlled trials do not know their group, those in the control arm are less likely to drop out, seek other treatment or change their behavior (better compliance and follow-up in both arms), so attrition is less likely to differ between groups. New drugs and vaccines pass through numbered clinical trial phases: Phase I (a small group, often healthy volunteers: safety and dose), Phase II (a few hundred people with the condition: effectiveness and side effects), Phase III (large randomized trials, often thousands: confirm efficacy against placebo or standard treatment, monitor adverse events; the basis for approval) and Phase IV (after approval: post-marketing surveillance of long-term and rare effects and comparisons in routine use). The control group of a trial of a new heart drug should get the current standard drug (or a placebo if no standard treatment exists), because withholding effective treatment would be unethical. Randomization balances groups only on average: small chance differences in baseline characteristics between the arms are expected, especially in small trials, and do not mean randomization failed (large differences can be adjusted for in the analysis). When assignment is not random, allocation bias (a form of selection bias) can creep in, for example if doctors put sicker patients in one group; random, concealed allocation prevents it.
Measures of association
Analytic studies compare groups, and the comparison always starts with a 2 × 2 table. Put exposure in rows and outcome in columns, and label the cells the same way every time:
| Ill | Not ill | Total | |
|---|---|---|---|
| Exposed | a | b | a + b |
| Not exposed | c | d | c + d |
Odds are the chance an event happens divided by the chance it does not: odds = p ÷ (1 − p). Among 50 cases, 30 exposed and 20 unexposed give exposure odds of 30 ÷ 20 = 1.5. A risk of 50% is odds of 1 ("one to one"); a risk of 10% is odds of 0.11.
Interpreting and choosing a measure
- Which measure for which design? Cohort studies and trials: risk ratio (RR) from attack rates, or a rate ratio from incidence rates (49.6 vs 17.7 strokes per 100,000 person-years gives a rate ratio of 2.8). Case-control studies: odds ratio only, because the investigator fixed the number of cases and controls, so the "risk" in each row is meaningless. Cross-sectional studies: prevalence ratio or prevalence odds ratio.
- OR vs RR. When the disease is rare (under about 10% in each group), the OR approximates the RR, so an OR can stand in for an RR. When the disease is common, the OR is farther from 1 than the RR: it exaggerates the effect in either direction: further above 1 than the RR for a harmful exposure, further below 1 for a protective one.
- Words to write. RR = 3: "the exposed group had 3 times the risk of illness compared with the unexposed group." RR = 1: no association; the risk is the same in both groups. RR = 0.75: "the exposed had 25% lower risk," a protective association (a vaccine or helmet). OR = 1: the odds of exposure are the same for cases and controls.
- Other measures of association you may see: the hazard ratio (a ratio of instantaneous event rates from survival analysis, read like an RR), the rate ratio and the prevalence ratio. Person-time, incidence and prevalence are measures of frequency, not association; the number needed to treat (1 ÷ risk difference) is a measure of clinical impact.
- Relative vs absolute. RR and OR are relative measures that tell you how strong an association is (useful for judging causation). Attributable risk (risk difference) is an absolute measure that tells you how much disease the exposure adds, which matters more for public health planning.
- Food-specific tables. For each food, compute the attack rate in those who ate it and those who did not, then the RR. The culprit usually has the highest RR, a high attack rate among eaters, a low one among non-eaters, and accounts for most cases. If an attack rate in the unexposed group is 0, the RR cannot be calculated (division by zero) even though the association looks strong.
Confidence intervals (Division C)
A measure of association is an estimate; a 95% confidence interval shows the range of values compatible with the data. You only need to read them, never calculate them. Two rules handle nearly every question:
- If the CI for an RR or OR includes 1, the association is not statistically significant at the 5% level. OR = 1.8 (95% CI 0.7–4.6) could be no effect at all.
- A narrow CI means a precise estimate, usually from a large study. OR = 3.2 (95% CI 1.4–7.3) is significant but imprecise; RR = 3.2 (95% CI 2.9–3.5) is significant and precise.
A CI that sits entirely below 1, such as RR = 0.4 (0.2–0.7), indicates a significant protective association. A higher confidence level gives a wider interval from the same data (a 99% CI is wider than a 95% CI, which is wider than a 90% CI), because you need a broader range to be more confident it contains the true value.
The "null value" depends on the measure. For ratio measures (RR, OR, rate ratio, prevalence ratio) no association is 1. For difference measures (risk difference or attributable risk, a difference in means; also 1 − ratio measures such as relative risk reduction and VE) no association is 0, so a CI for a risk difference of −2% to +5% is not significant because it includes 0.
Statistics for epidemiology
Disease Detectives tests include a steady stream of basic statistics: describe a data set, read a p-value, name an error type, pick a test. None of it needs more than a calculator, but the vocabulary has to be exact.
Describing data
Types of data. Nominal (categories with no order: sex, blood type, food eaten), ordinal (ordered categories: mild/moderate/severe, a 1–5 rating), discrete (counts: number of cases), and continuous (any value in a range: age, weight, incubation time). A finer scale, such as 0–10 instead of 1–5, captures smaller differences and can reduce responses piling up at the ends (ceiling and floor effects).
Central tendency. The mean is the arithmetic average; the median is the middle value when the data are ordered (the average of the two middle values for an even count); the mode is the most frequent value. The median resists outliers, so it is preferred for skewed data such as incubation periods and incomes. In a right-skewed (positively skewed) distribution, with a long tail of high values, typically mean > median > mode; in a left-skewed one, the order usually reverses.
Spread. The range is maximum minus minimum. The interquartile range (IQR) is the third quartile minus the first, the middle 50%, shown as the box of a box plot. The variance is the average squared distance from the mean, and the standard deviation (SD) is its square root, in the original units. The standard error of the mean (SE = SD ÷ √n) measures how precisely the sample mean estimates the population mean; it shrinks as the sample grows, while the SD does not.

Correlation describes how two continuous variables move together: positive (both rise), negative (one rises as the other falls) or none. The correlation coefficient r runs from −1 to +1. Correlation is not causation: countries that eat more chocolate have more Nobel laureates, but wealth is the obvious confounder.
Hypothesis testing, p-values and errors
A study starts from the null hypothesis (H₀): there is no association between exposure and outcome (RR or OR = 1, no difference between groups). The alternative hypothesis (H₁ or Hₐ) says there is one. Example: H₀ "physicians are no more likely than other hospital staff to get SARS"; H₁ "physicians are more likely."
The p-value is the probability of getting results at least as extreme as those observed if the null hypothesis were true. It runs from 0 to 1. If p is below the chosen significance level α (usually 0.05), the result is statistically significant and you reject H₀. A p-value of 0.00000064 means data this extreme would be very unlikely if there were no real association, so chance alone is an implausible explanation. It does not tell you the size of the effect, whether it matters clinically, or whether bias or confounding produced it; a tiny, unimportant difference can be significant in a huge study.
| H₀ actually true (no real effect) | H₀ actually false (real effect) | |
|---|---|---|
| Reject H₀ ("significant") | Type I error (α): false positive | Correct: power = 1 − β |
| Fail to reject H₀ | Correct | Type II error (β): false negative |
- Type I error (α): concluding there is an association when there is none (a false alarm). Its probability is the significance level, usually 5%.
- Type II error (β): missing a real association. Small studies have low power (1 − β) and commit more Type II errors. Power increases with a larger sample size, a larger true effect (a bigger difference to detect), less variability or measurement error, and a higher α (accepting more Type I error); power of 80% is a common target.
- A 95% confidence interval that excludes 1 (for RR or OR) corresponds to p < 0.05. Wider intervals come from smaller samples.
- Random error (chance) is what p-values and confidence intervals address; a larger sample reduces it. Systematic error (bias) is not fixed by a larger sample. Some tests list "four types of error" as random error, systematic error, Type I and Type II.
Choosing a statistical test
| Test | Use it to compare | Notes |
|---|---|---|
| Chi-square (χ²) test | Proportions in a contingency (2 × 2) table: is illness associated with eating a food? | Needs reasonably large numbers; unreliable when any expected cell count is below 5 |
| Fisher's exact test | The same 2 × 2 question with small samples | Exact probability; used in small outbreaks |
| t-test | Means of two groups (mean age of cases vs controls) | Uses the sample SD; preferred for small samples |
| z-test | Means or proportions when the sample is large or the population SD is known | — |
| ANOVA | Means of three or more groups | — |
| Mantel–Haenszel | Combines stratified 2 × 2 tables into one adjusted OR or RR | Controls confounding by the stratifying variable |
| Correlation / regression | Relationship between continuous variables; adjusting for several confounders at once (multivariable regression) | Logistic regression gives adjusted odds ratios |
A full case scenario
Most points come from scenarios like this one, so practice the whole chain of reasoning.
The report. On Wednesday morning a school nurse reports that many students who went on Tuesday's field trip are vomiting. All 120 students and chaperones ate a packed lunch at noon on Tuesday; 35 are now ill, with onsets between 4 pm Tuesday and 2 am Wednesday.
Is it an outbreak? Thirty-five similar illnesses after one shared meal is far above any baseline. Verify the diagnosis with stool specimens and leftover food.
Case definition. "Vomiting or diarrhea beginning between noon Tuesday and noon Thursday in a student or adult who attended the field trip." Clinical criteria, person, place and time; no mention of any food.
Descriptive epidemiology. All onsets fall within a 10-hour span after one meal: a point-source epi curve. The scenario's background note gives a typical incubation of a few hours to about 15 hours, consistent with the lunch (onsets 4 to 14 hours after noon).
Analytic epidemiology. The whole exposed group is known, so run a retrospective cohort: interview all 120 people about what they ate.
| Food | Ate: ill / total | Attack rate | Did not eat: ill / total | Attack rate | RR |
|---|---|---|---|---|---|
| Turkey sandwich | 21 / 70 | 30.0% | 14 / 50 | 28.0% | 1.07 |
| Coleslaw | 30 / 45 | 66.7% | 5 / 75 | 6.7% | 10.0 |
| Apple juice | 30 / 100 | 30.0% | 5 / 20 | 25.0% | 1.2 |
The culprit has a high attack rate among those who ate it, a low attack rate among those who did not, and accounts for most cases: the coleslaw (30 of 35 cases ate it; RR 10.0). Apple juice was also consumed by 30 cases, but nearly everyone drank it, and the attack rates in drinkers and non-drinkers are almost the same.
The five cases who did not eat coleslaw. Expect a short-answer question on them. Reasonable explanations: they misremember what they ate (recall error, misclassification), a serving utensil cross-contaminated another item, they are secondary cases infected by a sick classmate, or they have an unrelated illness that happens to meet the case definition.
Laboratory and environment. Matching organisms in patients and leftover coleslaw, ideally with matching DNA fingerprints, confirm the source. An environmental investigation asks how the coleslaw was prepared and kept cold, and whether an ill food worker handled it.
Control, surveillance, communication. Discard the remaining product, exclude ill food workers until they recover, reinforce handwashing at the school, watch for secondary cases among families, and report to the school, the caterer and the state health department.
Causation
An association, even a strong one, is not proof of cause. The rules ask you to apply Bradford Hill's criteria to outbreak data and compare them with older and newer frameworks.
| Bradford Hill criterion | The question it asks |
|---|---|
| Strength | How large is the RR or OR? Strong associations are harder to explain by bias |
| Consistency | Have different studies, places and methods found the same association? |
| Specificity | Does the exposure lead to one particular outcome? (Weakest criterion: smoking causes many diseases) |
| Temporality | Did the exposure come before the disease? The only criterion that must be met |
| Biological gradient | Does more exposure produce more disease (dose–response)? |
| Plausibility | Is there a believable mechanism or explanatory theory (usually biological, but can be behavioral or social)? Limited by current knowledge |
| Coherence | Does the association fit what is already known about the disease? |
| Experiment | Does removing or reducing the exposure reduce the disease? |
| Analogy | Do similar exposures cause similar effects? |
Scenario questions describe evidence and ask which criterion it supports. Match on the clue words:
| Clue in the scenario | Criterion |
|---|---|
| "RR = 10," "OR of 3.5," "a large effect" | Strength of association |
| "Similar results in five other countries," "a second lab repeated the study" | Consistency |
| "The exposure is linked to only this one disease," "this disease has no other known cause" | Specificity |
| "The exposure happened before symptoms began" | Temporality |
| "Workers exposed longer had higher risk," "IQ fell 0.18 points per ppm of mercury" | Biological gradient (dose–response) |
| "A biologically sound mechanism was later found" | Plausibility |
| "Fits with lab findings and what is known about the disease" | Coherence |
| "Cases dropped after the product was recalled," "a vaccine reduced the disease" | Experiment (experimental evidence) |
| "A related virus causes a similar illness" | Analogy |
Hill himself said that none of his viewpoints is an absolute requirement, though temporality is logically necessary for causation; some authors add reversibility (removing the cause reduces the effect) as a tenth. Hill's list does not include generalizability, symptoms or statistical significance.
Koch's postulates (Robert Koch, 1880s, built on Jakob Henle's ideas and first applied to anthrax and tuberculosis) were designed for bacterial diseases:
- The microorganism must be found in abundance in all organisms with the disease, but not in healthy ones.
- It must be isolated from a diseased organism and grown in pure culture.
- The cultured microorganism must cause the disease when introduced into a healthy, susceptible host.
- It must be re-isolated from the newly diseased host and shown to be identical to the original.
They break down for asymptomatic carriers (which violate postulate 1), agents that cannot be grown in pure culture (viruses need living cells; prions and Mycobacterium leprae cannot be cultured in the usual way), diseases with several causes, diseases in which only some infected people get sick, and noninfectious causes such as chemicals (a solvent causing cancer cannot be "cultured"). Finding E. coli in the implicated food alone does not satisfy them.
Evans's postulates (Alfred Evans, 1976) updated causal reasoning for modern epidemiology and immunology and can handle carriers, viruses and chronic disease. Evans listed ten criteria; in summary: (1) disease is more common in people exposed to the putative cause than in those not exposed; (2) exposure is more common in cases than in people without the disease; (3) exposure comes before disease (temporality), and incubation periods after exposure follow a bell-shaped (log-normal) distribution; (4) the host shows a measurable response after exposure (such as antibodies), and that response follows a biological spectrum from mild to severe; (5) the disease can be reproduced experimentally in some way; and (6) preventing or modifying the exposure, or the host's response (for example by vaccination), reduces or eliminates the disease; his final criterion is that the whole relationship should make biological and epidemiological sense.
Newer causal models in the 2027 outline:
-
Sufficient–component cause model ("causal pies"): a disease happens when a complete sufficient cause forms, and each sufficient cause is a set of component causes. A necessary cause appears in every pie (Mycobacterium tuberculosis for tuberculosis, but exposure alone is not sufficient; host factors complete the pie). Blocking any one component prevents every case that pie would have produced, which is why one intervention can prevent a lot of disease. Because one case can be blamed on every component in its pie, the fractions of disease attributable to each component overlap and can add up to more than 100%. A factor that is always followed by disease is a sufficient cause; a factor that must be present for disease to occur is a necessary cause. The model was introduced by Kenneth Rothman (1976).
-
Directed acyclic graphs (DAGs): diagrams in which arrows show assumed causal effects and no path loops back on itself. They tell you which variables to adjust for. A confounder causes both exposure and outcome (adjust for it). A mediator lies on the path from exposure to outcome (do not adjust if you want the total effect). A collider is caused by both exposure and outcome (adjusting for it creates a false association). An arrow means a direct causal effect of one variable on another, not just a correlation.
-
GRADE: a system for rating the certainty of a body of evidence as high, moderate, low or very low. Randomized trials start high and observational studies start low; certainty is downgraded for risk of bias, inconsistency, indirectness, imprecision or publication bias, and can be upgraded for a large effect, a dose–response gradient, or when all plausible confounding would only weaken the observed effect.
The three roles a third variable can play in a DAG:
| Role of the third variable | Arrows in the DAG | Example | Adjust for it? |
|---|---|---|---|
| Confounder | Exposure ← C → Outcome | Smoking causes both coffee drinking (in this example) and heart disease | Yes: stratify, match or adjust |
| Mediator | Exposure → M → Outcome | Excess salt → high blood pressure → stroke | No, if you want the total effect of the exposure |
| Collider | Exposure → C ← Outcome | Hospital admission, caused by both the exposure and the disease (this is how Berkson's bias arises) | No: conditioning on it creates a false association |
Bias, error and confounding
Any observed association has four possible explanations: chance (random error), bias (systematic error), confounding, or a true cause. Random error shrinks as studies get larger and shows up as wide confidence intervals. Systematic error does not shrink with sample size; it comes from how the study was designed or run.
| Problem | What goes wrong | Example | How to reduce it |
|---|---|---|---|
| Selection bias | Who enters or stays in the study depends on both exposure and outcome | Hospital controls who are sicker than the source population; volunteers; healthy worker effect; loss to follow-up in a cohort | Controls from the same source population as cases; high participation and follow-up |
| Recall bias | Cases remember past exposures differently from controls | Parents of a child with a birth defect search their memories harder | Use records; pick controls who also have an illness |
| Interviewer bias | Interviewers probe cases more thoroughly | An interviewer who knows who is a case asks cases more follow-up questions about the suspect food | Blinding; standardized questionnaires |
| Misclassification | Exposure or disease recorded wrongly; non-differential misclassification biases toward RR = 1 | Imperfect lab test; vague food history | Better measurement; validated tests and questionnaires |
| Confounding | A third variable linked to both exposure and outcome (and not on the causal path) distorts the association | Coffee looks like a cause of heart disease because coffee drinkers smoke more | Design: randomization, restriction, matching. Analysis: stratification, adjustment |
| Effect modification | The association truly differs between subgroups, often defined by personal characteristics (age, sex, race, genetics, immune status) that change susceptibility | A vaccine protects children better than older adults; smoking and asbestos together multiply lung-cancer risk | Report each subgroup separately; do not average |
Bias comes in two big families. Selection bias distorts who is in the study (or who stays in it); information bias (measurement or observation bias) distorts what is recorded about them. Confounding is sometimes listed as a third family. Tests use many named sub-types; the table below gives each one a family and a typical scenario.
ReferenceNamed biases and effects· 34 rows
S = selection bias, I = information bias, Sc = screening-related bias, O = other.
No rows match.
| Bias or effect | Family | What happens | Typical scenario |
|---|---|---|---|
| Sampling bias | S | Some members of the population are less likely to be sampled, so the sample is unrepresentative (hurts external validity) | Phone survey only from 9 am to 4 pm misses working people; study limited to people with permanent addresses |
| Self-selection / volunteer bias | S | People who choose to take part differ from those who do not (often healthier and more health-conscious) | A program evaluated only on volunteers |
| Healthy user bias | S | People who enroll in and stick to a regimen are healthier in other ways | Trial participants who take every dose also exercise more |
| Non-response bias | S | People who do not answer differ from those who do | Many exposed diners decline the survey |
| Attrition / loss to follow-up | S | Participants who drop out differ from those who stay (cohort studies and trials) | Weight-loss trial participants who fail to lose weight quit |
| Healthy worker effect | S | Employed people are healthier than the general population, so workers look protected | Occupational cohort compared with the general public |
| Berkson's bias | S | Hospital-based cases and controls differ from the community; hospital controls may be more likely to have the exposure | Both groups recruited from hospital wards |
| Neyman bias (prevalence–incidence bias) | S | Using prevalent cases misses people who died quickly or recovered, so exposures linked to survival look important | Pneumonia patients who died before admission are not included |
| Detection / surveillance bias | S or I (texts differ) | The exposed are examined more closely, so their disease is found more often | Women on hormones see doctors more, so more endometrial cancer is diagnosed |
| Migration bias | S | People moving into or out of the study population change the results | Sick residents move away from a polluted area |
| Membership bias | S | Members of a group (a gym, a club) differ systematically from non-members | — |
| Referral (referral-filter) bias | S | Patients at referral centers or specialty clinics are sicker or more unusual than typical patients, because of who gets referred | A tertiary hospital's cases look more severe than community cases |
| Publication bias | O | Studies with positive results are more likely to be published | A meta-analysis that finds only positive studies |
| Recall bias | I | Cases remember exposures differently from controls | Parents of children with leukemia recall pesticide use more completely |
| Interviewer bias | I | The interviewer's knowledge or expectations change how questions are asked or recorded | Different questions for cases and controls |
| Observer bias / observer-expectancy effect | I | An observer's expectations affect what is measured or seen | A researcher assumes traits from a patient's appearance |
| Social desirability (response) bias | I | Participants give the answers they think are acceptable | Under-reporting drug use or over-reporting exercise |
| Reporting bias | I | Participants selectively reveal or hide information | Hiding a stigmatized exposure |
| Misclassification, differential | I | Errors happen at different rates in compared groups; can push the estimate either way | Treated group weighed at the clinic, untreated group weighed at home |
| Misclassification, non-differential | I | Errors happen equally in all groups; usually biases toward the null (RR or OR → 1) | A crude dietary questionnaire used for everyone |
| Instrument bias | I | A faulty or miscalibrated instrument | A scale that always reads 1 kg high |
| Procedure bias | I | Groups are handled or tested differently | Two groups of rats fed by different procedures |
| Performance bias | I | Groups receive different care apart from the intervention | Treatment group gets more attention from staff |
| Hawthorne effect | I | People change their behavior because they know they are being observed | Participants in a monitored program report healthier habits |
| Placebo effect | I | Improvement from believing one is treated | Sugar-pill group reports less pain |
| Pygmalion and Golem effects | I | High (Pygmalion) or low (Golem) expectations from researchers or teachers raise or lower subjects' performance | — |
| Confirmation bias | O | Favoring data that support one's hypothesis | Researchers discount findings that contradict them |
| Lead-time bias | Sc | Screening finds disease earlier, so survival from diagnosis looks longer even if death occurs at the same time | Patients screened and treated sooner "survive longer" |
| Length-time bias | Sc | Screening preferentially finds slow-growing disease with a better prognosis | Screen-detected tumors look less deadly |
| Overdiagnosis | Sc | Screening finds disease that would never have caused symptoms | Small, slow cancers treated unnecessarily |
| Late-look bias | S | Information gathered late in a disease misses severe cases that have already died | — |
| Ecological fallacy | O | Concluding about individuals from group-level data; arises because a group average hides variation (the group is not homogeneous), because the people exposed may not be the ones who got sick, and because group-level confounders are uncontrolled; applying it to people is a form of stereotyping | Countries with more vaping have more lung cancer, so vapers get lung cancer |
| Simpson's paradox | O | A trend in each subgroup reverses or disappears when groups are combined, because of confounding | A treatment looks better overall but worse in every age group |
| Regression to the mean | O | Extreme measurements tend to be followed by values closer to average | A program started after an unusually bad year seems to work |
Validity, reliability and precision. Internal validity asks whether the study measured the association correctly in the people studied; selection bias, information bias and confounding threaten it. External validity (generalizability) asks whether the result applies to other people; a study done only on one group (one city that is almost entirely white, only volunteers, only coal miners) has limited external validity. Accuracy (validity of a measurement) is closeness to the true value; precision (reliability, reproducibility) is how close repeated measurements are to each other. A miscalibrated scale can be precise but not accurate. Random error lowers precision; systematic error lowers accuracy.
Controlling confounding. In the design: randomization (balances known and unknown confounders, the main advantage of an RCT), restriction (study only one level of the confounder, such as only nonsmokers), and matching (choose controls with the same age, sex or other confounder as each case). In the analysis: stratification, standardization (adjusted rates), and multivariable modeling. Confounding is a form of systematic error.
Stating limitations
Division C questions often ask for "two limitations of this study." Run down this checklist and name the specific way each applies to the scenario:
- Sample size: few cases, so wide confidence intervals and low power (random error).
- Selection: who was enrolled or who responded; non-response; controls not from the same source population; loss to follow-up.
- Information: recall bias (interviews days or weeks later), interviewer bias, self-reported exposures, misclassification from imperfect tests or vague case definitions.
- Confounding: a third factor not measured or not adjusted for.
- Design limits: cross-sectional or ecological data cannot show temporality or individual-level links; case-control cannot give incidence.
- Generalizability: results from one school, ship or town may not apply elsewhere (external validity).
Choosing controls and collecting data
In a case-control study, good controls come from the same population that produced the cases and would have been counted as cases if they had become ill. Options include community controls (random-digit dialing, neighbors), friends nominated by cases, and hospital controls. Neighbors and friends may share the exposure (biasing the OR toward 1); hospital controls may have conditions linked to it. To reduce recall bias, choose controls who also have a serious illness, so both groups have searched their memories. Data can come from interviews, self-administered questionnaires, medical records, purchase records such as shopper cards, lab tests and environmental samples; records avoid recall problems but may be incomplete.
Stratification
To check for confounding, compute the measure separately within each level of the suspected confounder.
The rule: if the stratum-specific measures are similar to each other but different from the crude, the variable is a confounder; report an adjusted summary (for example, a Mantel–Haenszel estimate, named for Nathan Mantel and William Haenszel, 1959). If the stratum-specific measures are different from each other, the variable is an effect modifier; report the strata separately.
Screening tests
Screening finds disease in people without symptoms, and test-evaluation questions appear in surveillance, case definitions and secondary prevention. Set up the table with the test result in rows and true disease status in columns.
| Disease present | Disease absent | |
|---|---|---|
| Test positive | True positive (TP) | False positive (FP) |
| Test negative | False negative (FN) | True negative (TN) |

In words: sensitivity is the proportion of people with the disease who test positive (the true-positive rate); specificity is the proportion of people without the disease who test negative (the true-negative rate); PPV is the proportion of people who test positive who really have the disease; NPV is the proportion who test negative who really do not. A false negative has the disease but tests negative; a false positive does not have it but tests positive. The same words apply to a case definition or a surveillance system.
Screening programs have their own biases: lead-time, length-time and overdiagnosis bias (see the named-bias table).
Moving the cut-off. Lowering the threshold for a positive result (calling 30% dietary fat "high" instead of 35%) catches more true cases, so sensitivity rises and false negatives fall, but more healthy people are labeled positive, so specificity falls and false positives rise. Raising the cut-off does the reverse. Sensitivity and specificity trade off against each other; a receiver operating characteristic (ROC) curve plots sensitivity against 1 − specificity for every cut-off, and the diagonal line from (0, 0) to (1, 1) is a useless test, no better than chance.
Rule out vs rule in (mnemonic SnNout: a Sensitive test, when Negative, rules out; SpPin: a Specific test, when Positive, rules in). A highly sensitive test, when negative, rules disease out (few false negatives): use it for screening, early outbreak case-finding, blood-bank screening and diseases where missing a case is dangerous. A highly specific test, when positive, rules disease in (few false positives): use it to confirm, and when a false positive would cause harm, cost or stigma. Programs often test in series (a sensitive screen, then a specific confirmatory test on the positives), which raises overall specificity; testing in parallel (positive if either test is positive) raises sensitivity.
Why PPV falls when disease is rare. When few people have the disease, even a small false-positive rate among the many healthy people produces more false positives than true positives. That is why screening a low-prevalence population for a rare disease gives a low PPV: the same false-positive rate produces more false alarms per true case where disease is rare. Ignoring this is called the base-rate fallacy. The rule that links prevalence (the pre-test probability) to predictive value is Bayes' theorem. Spectrum bias is a related problem: a test evaluated only on very sick cases and very healthy controls looks more sensitive and specific than it will be in the mixed, milder population where it is actually used.
A good screening program targets an important health problem with a recognizable early (preclinical) stage; has a test that is sensitive, specific, safe, cheap, quick, simple, acceptable to the public, reliable and valid; offers effective treatment that works better when started early; and has facilities for diagnosis and follow-up of positives. These ideas come from Wilson and Jungner's principles for WHO (1968).
Kinds of laboratory test. An antigen test detects proteins of the pathogen itself, so it shows current infection (rapid tests); a PCR (or RT-PCR for RNA viruses) test detects the pathogen's genetic material and is more sensitive; an antibody (serologic) test detects the immune response, so it shows past or recent infection or vaccination, and can be negative early in infection. Culture grows the organism and allows typing and resistance testing, but takes days.
Vaccines, reproduction numbers and herd immunity
Immunity
Active immunity means your own immune system produces antibodies and memory cells, either naturally (after infection) or artificially (after vaccination). It takes days to weeks to develop but can last years. Passive immunity means receiving ready-made antibodies, either naturally (across the placenta or in breast milk) or artificially (immune globulin, antitoxin). It works immediately but fades within weeks to months.
| Active (your body makes antibodies; slow to develop, long-lasting, memory) | Passive (antibodies made elsewhere; immediate, temporary, no memory) | |
|---|---|---|
| Natural | Recovering from an infection (catching chickenpox from a sibling) | Maternal antibodies across the placenta or in breast milk |
| Artificial | Vaccination (including toxoids) | Injected immune globulin (gamma globulin), antitoxin, antivenom, monoclonal antibodies, convalescent plasma |
An antigen is the molecule the immune system recognizes (on a pathogen or in a vaccine); an antibody is the protein B cells make to bind it. Vaccines work by training the adaptive immune system: B cells (which mature into antibody-secreting plasma cells) make antibodies, helper T cells (CD4, the cells HIV destroys) coordinate the response, cytotoxic T cells (CD8) kill infected cells, and long-lived memory B and T cells respond quickly on later exposure. An immunoassay is a lab test that uses antigen–antibody binding to detect one of them; the ELISA (enzyme-linked immunosorbent assay) is the classic example, and rapid antigen tests are immunoassays too. "Serologic evidence of immunity" means a blood test found protective antibodies; a few people with such evidence can still become infected, because no immunity is 100% and antibody levels wane.
| Vaccine type | What it contains | Strengths and limits | Examples |
|---|---|---|---|
| Live attenuated | Weakened live pathogen that still replicates | Strong, long-lasting immunity, often from one or two doses; not for people with weakened immunity or (usually) pregnancy; needs cold storage | MMR, varicella, oral polio (OPV), yellow fever, nasal flu vaccine |
| Inactivated (killed) | Whole pathogen killed by heat or chemicals | Cannot cause infection; weaker response, so boosters needed | Injected polio (IPV), hepatitis A, rabies, most flu shots |
| Toxoid | Inactivated bacterial toxin | Immunity to the toxin, not the bacterium | Tetanus, diphtheria (the "T" and "D" in DTaP and Tdap) |
| Subunit, recombinant, polysaccharide, conjugate | Selected pieces: proteins, sugars, or sugars linked to a protein | Very safe; may need adjuvants and boosters | Hepatitis B, HPV, acellular pertussis, pneumococcal, Hib, shingles (recombinant) |
| mRNA | Messenger RNA that makes cells produce the antigen protein | Fast to design and update; needs cold storage | COVID-19 (Pfizer-BioNTech, Moderna) |
| Viral vector | A harmless virus carrying the antigen's gene | Strong response | Some COVID-19 and Ebola vaccines |
Vaccine efficacy and effectiveness
Efficacy is how well a vaccine works under ideal, controlled conditions, measured in a randomized trial. Effectiveness is how well it works in real-world use, measured with observational designs (cohort, case-control, screening method).
Both are the proportionate reduction in disease among vaccinated people compared with unvaccinated people; the formula is the same, only the study setting differs. Effectiveness is usually lower than efficacy because real-world vaccines are stored, timed and given less perfectly, and the people vaccinated are less carefully selected. Errors in recording who was vaccinated are information bias (misclassification of exposure). Trials stratify by age and health risk because those factors change both infection risk and vaccine response. Vaccine efficacy trials need very large samples (often tens of thousands) when the infection is uncommon: participants are protected or not by the vaccine, but whether they get sick depends on natural exposure, so only a small number of cases (events) accumulate in each arm, and enough events are needed to measure a difference.
Two more observational designs for effectiveness (Division C): the test-negative design, now standard for influenza and COVID-19, enrolls people who seek care for the same symptoms and are tested; those who test positive are cases and those who test negative are controls, and VE = 1 − OR for vaccination. Because both groups sought care, differences in health-care seeking are largely balanced. The household (secondary attack rate) method compares secondary attack rates among vaccinated and unvaccinated household contacts of a case: VE = 1 − SAR(vaccinated) ÷ SAR(unvaccinated).
Reproduction numbers and the herd immunity threshold
The basic reproduction number R₀ is the average number of secondary cases one infectious person causes in a population where everyone is susceptible. It depends on the contact rate, the chance of transmission per contact and how long a person stays infectious, and it has no units (it is a count of people per case). The effective reproduction number ( or ) is the average at a given time, once some people are immune or control measures are in place. An outbreak grows while R is above 1 and shrinks when it falls below 1.
Herd immunity is the indirect protection that unvaccinated or non-immune people get when enough of the population is immune that transmission chains break. It protects those who cannot be vaccinated, such as newborns and people with weakened immune systems. Its effects reach the whole community: overall incidence falls, outbreaks become smaller and rarer, older children and adults are protected from exposure, and keeping immunity above the threshold long enough can lead to elimination and, for a human-only disease, eradication (smallpox).
| Disease | Commonly quoted R₀ | HIT = 1 − 1/R₀ |
|---|---|---|
| Measles | 12–18 | about 92–94% |
| Pertussis | 12–17 | about 92–94% |
| Chickenpox (varicella) | 10–12 | about 90–92% |
| Polio | 5–7 | about 80–86% |
| Smallpox | 5–7 | about 80–86% |
| Mumps | 4–7 | about 75–86% |
| Seasonal influenza | about 1.3–2 | about 23–50% |
R₀ values are estimates that vary with setting, so a test will normally give you the number to use. A high R₀ (measles) means a very high HIT; a low R₀ (seasonal influenza, Ebola at about 1.5–2.5) means a lower one, but other factors decide whether herd immunity is achievable in practice: how effective and long-lasting the vaccine is, whether immunity blocks infection or only disease, whether the agent mutates (influenza, so new vaccines yearly), animal reservoirs, how evenly vaccination is spread (unvaccinated clusters can sustain outbreaks), and public acceptance.
The SIR model (Kermack and McKendrick, 1927) divides a population into Susceptible, Infectious and Recovered (or removed) people. New infections occur at a rate proportional to the product of susceptible and infectious people (β·S·I/N); infectious people recover at rate γ, and R₀ = β/γ. At the start, S ≈ N, so cases grow when R₀ > 1, stay level when R₀ = 1, and die out when R₀ < 1. As S falls, R_e = R₀ × S/N drops, and the epidemic peaks when R_e reaches 1. The SEIR model adds an Exposed (latent, not yet infectious) stage.


Disease control and prevention
Strategies of disease control
Control reduces the incidence, prevalence, illness or death from a disease to a locally acceptable level, and ongoing effort is needed to keep it there. Elimination reduces a disease to zero cases in a defined area (measles was declared eliminated from the United States in 2000; large outbreaks in 2025–26 put that status under review). Eradication reduces it to zero worldwide permanently, so control measures can stop; only smallpox (in humans, declared 1980) and rinderpest (in cattle, declared 2011) have been eradicated. Extinction goes one step further: the agent no longer exists in nature or in the laboratory. Smallpox is eradicated but not extinct, because stocks are kept at CDC in Atlanta and at the VECTOR institute in Russia. Diseases with an animal or environmental reservoir, no effective vaccine, or many silent infections are hard to eradicate; polio and Guinea worm disease are the current targets. HIV/AIDS, malaria and tuberculosis are at the control stage.
Control measures are organized by the link of the chain they break:
| Target | Examples |
|---|---|
| Agent and reservoir | Treat cases (some texts also list isolation here, because infected humans are the reservoir); remove or treat infected animals; destroy contaminated food; disinfect surfaces |
| Transmission | Treat water; pasteurize; handwashing; safe food handling; vector control (draining standing water, insecticides); masks; condoms; isolation of infected people and quarantine of exposed people (CDC's Principles of Epidemiology files isolation here, as interrupting direct transmission) |
| Host | Vaccination; prophylactic medicines after exposure; nutrition; protective equipment (some texts list quarantine here because it targets exposed hosts) |
Levels of prevention
| Level | Stage of natural history | Goal | Examples |
|---|---|---|---|
| Primordial | Before risk factors appear | Prevent the risk factors themselves | Policies that stop children from starting to smoke; walkable neighborhoods |
| Primary | Susceptibility | Prevent the disease from starting | Vaccination, seat belts, clean water, handwashing, condoms |
| Secondary | Subclinical, early disease | Detect and treat early to stop progression | Screening (mammograms, blood pressure checks), contact tracing with prophylaxis |
| Tertiary | Clinical disease | Limit disability and complications | Rehabilitation after stroke, diabetic foot care, physical therapy |
| Quaternary | Any stage | Protect patients from overmedicalization: unnecessary tests, treatments and harm from care itself | Avoiding needless imaging or antibiotics; choosing comfort care over aggressive surgery when it cannot help |
Some boundaries need care:
- Primordial vs primary. Healthy habits started early in life before any risk factor exists (teaching young children healthy eating and activity so obesity never develops) are primordial; the same habits adopted by someone who already has a risk factor, or aimed at a specific disease, are primary. Primordial prevention stops risk factors from appearing in the first place, usually through policy and environment for a whole population (parks and walking paths, limits on lead in paint, factory safety standards, school nutrition rules). Primary prevention protects people who already face a risk (a smoker quitting, exercising to prevent heart disease, sunscreen, vaccination, seat belts, mosquito nets, condoms, handwashing, masks, fall-prevention training for older adults, safety training for workers).
- Secondary vs tertiary. Secondary prevention is about early detection in people without symptoms, or with very early disease, followed by prompt treatment: screening (mammograms, Pap tests, blood pressure checks, monthly self-exams), contact tracing with preventive treatment, and treating mild early disease to stop progression (a stent for silent ischemia found on a stress test; removing precancerous moles). Tertiary prevention starts once disease is established and symptomatic and aims to limit damage: rehabilitation, physical therapy after surgery, cardiac rehabilitation and daily aspirin after a heart attack, support groups, chemotherapy for diagnosed cancer. Tests disagree on where curative treatment of diagnosed disease belongs; most keys put early treatment found by screening under secondary and treatment of established symptomatic disease under tertiary.
- Quarantine and isolation are usually classed as primary prevention for the people protected from exposure (they stop new infections).
ReferenceClassifying prevention activities· 13 rows
No rows match.
| Activity | Level |
|---|---|
| Vaccination (MMR, hepatitis A, flu shots in schools) | Primary |
| Regulating carcinogens in food; strict lead limits in paint | Primordial (a few keys say primary) |
| Building parks and walking paths; healthy school lunches policy | Primordial |
| Seat-belt and helmet laws; using seat belts | Primary (laws are sometimes called primordial) |
| Handwashing; masks; condoms; mosquito nets; insect repellent | Primary |
| Quitting smoking; exercising; healthy diet to prevent disease | Primary |
| Fluoridating water | Primary |
| Mammograms, Pap tests, colonoscopy, blood pressure and cholesterol screening; breast self-exams | Secondary |
| Testing contacts and giving preventive antibiotics | Secondary |
| Treating early, asymptomatic disease found by screening | Secondary |
| Chemotherapy or surgery for diagnosed cancer; daily aspirin after a heart attack to prevent another | Tertiary in most keys |
| Physical or occupational therapy; cardiac or stroke rehabilitation; support groups | Tertiary |
| Avoiding unnecessary tests, procedures and drugs | Quaternary |
Scope of prevention
Prevention can target the whole population (fluoridating water, lowering salt in processed food) or a high-risk group (statins for people with high cholesterol). A population strategy can prevent more cases overall, because many cases arise from the large number of people at moderate risk, even though each individual benefits only a little; this is the "prevention paradox" described by Geoffrey Rose.
| High-risk strategy | Population strategy | |
|---|---|---|
| Who | Individuals identified as high risk (often by screening) | Everyone, shifting the whole distribution of risk |
| Approach | Strong risk-factor control, often needing clinical action | Small changes for many people; must be cheap, safe and non-invasive |
| Strengths | Well-matched to individuals; motivates patients and doctors; good benefit-to-risk ratio for each person | Large total effect; tackles root causes; changes social norms |
| Weaknesses | Misses the many cases arising in people at moderate risk; screening costs; does not change root causes | Little visible benefit to each person (low motivation); any small harm is spread over everyone |
The Health Impact Pyramid (Thomas Frieden, 2010, written while he directed CDC) ranks interventions by population impact. At the base are socioeconomic factors (poverty, education); next, changing the context to make individuals' default decisions healthy (fluoridated water, smoke-free laws, safety rules that protect people without any individual effort); then long-lasting protective interventions (vaccines, a one-time screening); then clinical care; and at the top, counseling and education, which need the most individual effort per unit of impact.
Proposing and evaluating strategies (Division C)
A good proposal names the link of the chain or the level of prevention it targets, who carries it out, and how success will be measured. For example: "Require the caterer to keep coleslaw at or below 4 °C (40 °F) and train staff in handwashing (primary prevention, transmission link); measure success by surveillance for gastrointestinal illness after future events."
To evaluate an intervention, compare the outcome before and after, and ask whether the change could have happened anyway. Check for a secular trend (was the rate already falling?), regression to the mean (was the "before" period unusually bad?), and changes in how cases were counted. A comparison community without the program helps.
Raising vaccination in underserved groups is a common proposal question. Strong answers remove barriers to access (free vaccine, mobile clinics, school-based and pharmacy vaccination, extended hours, transportation), build trust (trusted messengers such as local doctors, faith and community leaders, community health workers, materials in the community's languages, addressing specific concerns) and use reminders and school-entry requirements, then track coverage through surveillance to measure success.
Strategy
- Divide the test by task. One partner takes the scenario and builds the tables and calculations while the other handles definitions, history and short answers; then swap to check each other's arithmetic.
- Build the note sheet around math and frameworks. Fit every formula from this guide with a one-line example, the 2 × 2 layout, epi-curve shapes, the outbreak steps, the 5-step surveillance cycle and attributes, the study-design table, Bradford Hill criteria, the bias table, levels of prevention and the Health Impact Pyramid. Leave out pathogen lists; the rules exclude them as required knowledge and let tests supply such facts when needed.
- Show work every time. Write the formula, substitute the numbers and state units ("per 100", "per 1,000 person-years"). Graders give partial credit and score reasoning.
- Answer in specific sentences. "The case definition must not include the salad, or every case is exposed by definition" earns more than a vague paragraph.
- Skim the whole test first. Late scenarios are often worth the most points.
Common pitfalls
Wrong denominator for the attack rate
Use the population at risk (everyone who attended, ate or was exposed), not the whole town, and not just the cases.
Computing a risk ratio from a case-control study
Investigators chose how many cases and controls to enroll, so risks are meaningless. Report the odds ratio.
Calling a plateau "propagated"
A plateau is a continuous common source. Propagated spread shows successive peaks about one incubation period apart.
Specificity is not the false-positive rate
The false-positive rate is 1 − specificity. Specificity is the share of healthy people who test negative.
Treating cross-sectional data as proof of cause
A survey measures exposure and disease at the same time, so it cannot show temporality, the one Bradford Hill criterion that must be met.
Using the whole population for a case-fatality rate
CFR divides deaths by people with the disease, not by the population (that is the cause-specific mortality rate) and not by hospitalized patients.
Infant mortality per population
Infant, neonatal and maternal measures use live births as the denominator.
Calling an index case the first case
The index case is the first case noticed by investigators; the primary case is the one that introduced the disease. They are often, but not always, the same person.
Calling active surveillance "passive" because a hospital is involved
Ask who starts the contact. If the health department calls or visits, it is active; if the hospital sends reports on its own schedule, it is passive.
Reading a non-significant result as "no effect"
A 95% CI of 0.6–3.5 includes 1, so the study cannot exclude no association, but it also cannot exclude a large one. Small studies often miss real effects (Type II error).
How tournaments test this
The site's archive holds 22,376 Disease Detectives questions from public tournament tests across the 2016-17 to 2025-26 seasons (12,687 Division C, 8,302 Division B, 1,387 shared). The practice bank holds 31,234 Disease Detectives questions: about 16,500 match questions in these archive tests, and most of the rest come from other tournament tests the archive does not have.
A keyword classification of about 31,000 distinct practice-bank questions (October 2026) gives a rough picture of where points come from: transmission and the chain of infection about 11%, measures of disease frequency 8%, prevention and control 8%, study design 8%, surveillance 7%, vocabulary 6%, screening tests 5%, agent types and noninfectious causes 5%, natural history 4%, history 4%, measures of association 4%, bias 4%, the public health approach 4%, case definitions and descriptive epidemiology 3%, herd immunity and R₀ 3%, causation 3%, outbreak steps 3%, epi curves 2%, confounding 2%, immunity types 2%, statistics and confidence intervals 2%, attack rates 1.5%, molecular epidemiology 1%. Every one of these has a section above.
- Format. 58% of archived questions are free response and 34% multiple choice; the rest are numeric, true/false and select-all. Expect to write sentences, since scoring rewards reasoning.
- Topics (tags overlap): general epidemiology and vocabulary 24%, statistics and calculations 23%, outbreak investigation 20%, study design 18%, pathogens and transmission 17%, prevention 15%, surveillance 9%. Many "pathogen" questions on older tests are disease trivia the rules exclude; the transmission and agent-category questions still apply.
- Task shapes. About one question in seven is built on a case scenario (a camp, a cruise ship, a school, a wedding). Common tasks: compute attack rates, RR, OR and prevalence from a table; classify an epi curve; write a case definition; choose a study design and a control group; apply a Bradford Hill criterion; name the level of prevention or type of surveillance; calculate a herd immunity threshold.
- Recurring terms. "Case definition" appears in about 840 questions; "relative risk", "attack rate" and "odds ratio" in roughly 560–730 each; "herd immunity" in about 610; "Bradford Hill criteria" in about 360; "positive predictive value", "case fatality rate", "secondary attack rate" and "healthy worker effect" in about 90–150 each.
- Most common correct answers: cohort, case-control, primary/secondary/tertiary prevention, vector, fomite, epidemic, pandemic, endemic, cluster, virulence, pathogenicity, active, passive, sentinel and syndromic surveillance, public health approach, temporality, cross-sectional, John Snow, Edward Jenner, herd immunity, zoonosis, reservoir.
Test yourself
Real questions from public tournament tests. Each one links to the full test.
- 1
Who is credited with first shifting explanations of disease from supernatural causes to rational observation?
1 question from this set is no longer available.
Practice more Disease Detectives questions →
- 1
Investigators identify children with asthma and compare their past exposures to those without asthma. This study is:
Practice more Disease Detectives questions →
- 1
If the VOC-related cancer has a very high mortality rate and patients die quickly after diagnosis, how will this affect the observed Prevalence?
From: Crystal Lake Central Invitational - IL, 2025-26, Division C
Practice more Disease Detectives questions →
- 1
What is it called when a large proportion of individuals within a given population is consistently infected with a disease?
From: UT Invitational 2021-2022, Division B
Practice more Disease Detectives questions →
Condensed facts
A one-page summary of the formulas and frameworks above, laid out for the event's single allowed sheet. Copy what you need onto your sheet and add your own worked examples in the margins.
References and further reading
- CDC, Principles of Epidemiology in Public Health Practice, 3rd ed., including the glossary the rules name: https://archive.cdc.gov/www_cdc_gov/csels/dsepd/ss1978/index.html
- CDC Field Epidemiology Manual, "Conducting a Field Investigation": https://www.cdc.gov/field-epi-manual/php/chapters/field-investigation.html
- CDC, Updated Guidelines for Evaluating Public Health Surveillance Systems (MMWR 2001): https://www.cdc.gov/mmwr/preview/mmwrhtml/rr5013a1.htm
- CDC PulseNet: https://www.cdc.gov/pulsenet/
- Hill AB, "The Environment and Disease: Association or Causation?", Proc R Soc Med 1965: https://doi.org/10.1177/003591576505800503
- Rothman KJ, "Causes", Am J Epidemiol 1976 (sufficient–component cause model): https://doi.org/10.1093/oxfordjournals.aje.a112335
- Evans AS, "Causation and disease: the Henle-Koch postulates revisited", Yale J Biol Med 1976.
- Guyatt GH et al., "GRADE: an emerging consensus on rating quality of evidence and strength of recommendations", BMJ 2008: https://doi.org/10.1136/bmj.39489.470347.AD
- Fine P, Eames K, Heymann DL, "Herd immunity: a rough guide", Clin Infect Dis 2011: https://doi.org/10.1093/cid/cir007
- Farrington CP, "Estimation of vaccine effectiveness using the screening method", Int J Epidemiol 1993: https://doi.org/10.1093/ije/22.4.742
- Frieden TR, "A Framework for Public Health Action: The Health Impact Pyramid", Am J Public Health 2010: https://doi.org/10.2105/AJPH.2009.185652
- Science Olympiad (official rules and the event's CDC resources): https://www.soinc.org
- SciOly Wiki, Disease Detectives: https://scioly.org/wiki/index.php/Disease_Detectives
- Practice more: the Scio.ly test archive has hundreds of public Disease Detectives tests.