Meteorology
2027 season
On this page(26 sections)
Meteorology in the 2027 season is about severe weather and storms: how forecasters see a storm coming, why the atmosphere sometimes builds a supercell instead of a passing shower, what a hook echo or a debris ball on radar means, how a hurricane drives the sea onto land, and what people should do when a warning goes out. The Division B event is a data event first. At least half of every test is built on maps, radar and satellite images, soundings, graphs and tables, so the team that wins is the one that can look at a display, say what is happening, and explain the physics behind it in a few correct sentences.
The guide opens with the fundamentals every storm question leans on (heat and moisture, pressure and wind, soundings and stability, observing tools and forecast data, air masses and fronts), then works through the 2027 storm topics one by one, and closes with safety, the closed list of historic events, real tournament questions and condensed facts.
Event format
| Rule | Detail |
|---|---|
| Team | Up to 2 students |
| Time | About 50 minutes |
| Binder | One three-ring binder of any size; any content from any source, held in by the rings; sheet protectors, lamination, tabs and labels allowed |
| Calculators | Up to two Class II calculators |
| Writing utensils | Allowed |
| Expected in the binder | A U.S. map with the state names on it |
| Format | A written exam, or a station rotation with a fixed, announced time per station |
| Data share | At least 50% of questions rest on interpreting weather data shown as maps, graphs, images, photos, charts or tables |
| Scoring | High score wins; points for accurate answers, the quality of the supporting reasoning and the use of scientific technique; preselected questions break ties |
In a station rotation you cannot take pages out of the binder, and you cannot go back to a station once you leave it. You can, however, revise or add to an earlier answer while you sit at a later station, so write provisional answers and keep a list of the ones you want to revisit. Because reasoning earns points, a short "because" clause after every answer is worth the extra ten seconds.
What the rules cover
The 2027 rules give the event the theme Severe Weather & Storms. Storms (severe thunderstorms, tornadoes and waterspouts, damaging winds, tropical cyclones, winter storms) are the center of the event, and the fundamentals they rest on (humidity, stability, pressure and wind, global circulation, air masses, fronts, jet streams) are tested as the set-up for them. Sky optics, fog types, space weather and degree days are not in this outline; the heat index and wind chill appear only as hazards of heat waves and winter storms. The event is Division B only. The table groups the 2027 topic list (section 3c, items i to xv) into study areas; the wording is a paraphrase.
| Study area | Topics in the 2027 rules | Regional and invitational | State and National |
|---|---|---|---|
| Observing systems | Surface networks (ASOS, mesonets), radiosondes, buoys, aircraft; Doppler radar products (base and composite reflectivity, base velocity, correlation coefficient, storm-relative motion, wind profiles); visible, infrared and water-vapor satellite imagery | Full | Full |
| Forecast data | Surface maps, station models and METAR decoding; recent storm data (preferably 2022 to 2027); hodographs; computer model output; Stüve diagrams for clouds, shear and stability | Full | Full, plus Skew-T diagrams, the lifting condensation level (LCL) and CAPE |
| Setting up severe weather | Large-scale circulation, jet streams, stability, air masses, fronts, wind shear, atmospheric rivers, drylines; the role of oceans and large lakes (fetch, heat content, heat transport, storm wakes); terrain | Full | Full |
| Clouds | Identifying and interpreting the clouds tied to severe weather only | Full | Full |
| Drought and heat waves | Definitions, causes, effects | Full | Full |
| Precipitation | Formation (collision-coalescence, Bergeron process, riming, aggregation, temperature layers); snow, sleet, hail and hail size; freezing rain, freezing drizzle, rain; debris flows, mudslides and flash, stream, river and urban floods; impacts on structures and travel | Full | Full, plus intensity-duration-frequency (IDF) curves and return periods |
| Thunderstorms and lightning | Severe thunderstorm types (single-cell, multicell, supercell, MCC), structure, life cycles; cloud electrification, charge separation, lightning types and detection | Full | Full |
| Winds | Straight-line winds, downdrafts, downbursts, microbursts, macrobursts, gust fronts, squall lines, derechos, downslope winds; their radar signatures | Full | Full |
| Tornadoes and waterspouts | Life cycle, tracks, timing, geography, formation, structure; F and EF scales; reflectivity, velocity and correlation-coefficient images; bow echo, TVS, hook echo, debris ball | Full | Full |
| Tropical cyclones | Life cycle from invest to major hurricane; timing and geography; tracks and structure; Saffir-Simpson scale; storm surge; effects of terrain, shear, ENSO and pressure systems; eye, eyewall and rainbands on radar and satellite | Full | Full |
| Winter storms | Blizzards, nor'easters, lake-effect snowstorms, ice storms | Full | Full |
| Hazards and safety | Hazards of each storm type; NOAA/NWS watches and warnings; reliable information sources; preparedness; protective actions | Full | Full |
| Historic events and cases | A closed list of named events (see that section) plus recent data; data are supplied, not memorized | Full | Full |
The fundamentals chapters (Heat, moisture and pressure basics, Pressure, wind and global circulation, Soundings and stability and What sets up severe weather) cover the "Setting up severe weather" row and the Stüve and Skew-T items of "Forecast data"; the remaining chapters follow the table row by row, with drought and heat waves after winter storms.
Strategy
Split by display type, then cross-train. One partner can own radar and satellite imagery, the other soundings, hodographs and calculations; both need to read a surface map and to own the fundamentals (humidity, stability, pressure and wind, air masses and fronts), which make up about half of in-scope bank questions (see How tournaments test this). Station rotations punish a team that can only work one kind of station, so trade a practice test each week.
Build the binder for speed. Tab it in the order of the rules outline, and put these on the first pages:
- The Condensed facts from the end of this guide, printed, as the binder's first section.
- A radar key: reflectivity (dBZ) colors, velocity colors (inbound and outbound), correlation-coefficient values, and labeled examples of a hook echo, a bow echo, a TVS and a debris ball.
- The EF scale, the old F scale, the Saffir-Simpson scale, the hail-size chart and the NWS severe-thunderstorm criteria.
- A blank Stüve and Skew-T with dry adiabats, moist adiabats and mixing-ratio lines labeled, plus the LCL and CAPE formulas.
- A station-model key and a METAR decoder.
- The required U.S. map with state names, marked with Tornado Alley, Dixie Alley, the Great Lakes snowbelts and the Gulf and Atlantic coasts.
- One page per historic event in the rules, with the date, the storm type, and what made it notable, so you can recognize the data you are given.
Time management. Answer quick identifications first, then the data-interpretation questions (they are at least half the points), then long explanations. If a calculation stalls, write the setup and move on; partial reasoning still earns credit.
Heat, moisture and pressure basics
Every severe storm is a heat engine that runs on moisture and is steered by pressure differences. This chapter covers the vocabulary and the arithmetic that tests assume you already have: where weather happens (the troposphere), temperature scales, sensible and latent heat, the many ways of measuring humidity, air pressure, and the lifting mechanisms and ingredients every storm needs.
The troposphere and tropopause
The troposphere is the lowest layer of the atmosphere, where temperature usually falls with height (on average about 6.5 °C per km), where nearly all water vapor and clouds are found, and where weather happens. Its top, the tropopause, is where temperature stops falling; above it the stratosphere warms with height, so it is extremely stable. A thunderstorm updraft that reaches the tropopause loses its buoyancy and spreads sideways into a flat anvil; only the strongest updrafts punch a short way into the stratosphere as an overshooting top. The tropopause is highest over the tropics (about 16 to 18 km) and lowest over the poles (about 8 to 9 km), and it is higher in summer than in winter, because a warmer air column is thicker. That is why tropical thunderstorms and hurricanes are so tall, and why the jet streams sit at the "breaks" where the tropopause height changes sharply (see Jet streams and upper-air charts).
Temperature scales
Meteorologists use Celsius (°C) on maps and soundings, Fahrenheit (°F) in U.S. public forecasts and Kelvin (K) in any physics formula. A kelvin is the same size as a Celsius degree; a Fahrenheit degree is 5/9 as large. Zero kelvin is absolute zero.
Specific heat, sensible heat and latent heat
Specific heat is the energy needed to raise 1 kg of a substance by 1 °C. Water's is about 4,186 J/(kg·°C) (1 calorie per gram per °C), roughly five times that of dry soil or rock (about 800 J/(kg·°C)) and four times that of air (about 1,005 J/(kg·°C)). Water also mixes its heat downward and lets sunlight penetrate, while land heats only a thin surface skin. So oceans and large lakes warm and cool slowly and keep coastal climates mild, and the warm ocean in late summer and fall is what feeds hurricanes and lake-effect snow.
Sensible heat is heat you can feel and measure with a thermometer: adding it changes temperature. Latent heat ("hidden" heat) is taken in or released when water changes phase, with no change in temperature. Evaporating water at the surface stores energy in the vapor; when that vapor condenses in a cloud, the energy is released and warms the cloud air. That is how the sun's energy, absorbed at a warm sea surface, ends up powering an updraft 10 km above it.
| Phase change | Direction | Latent heat (per kg of water) | Effect on the surrounding air |
|---|---|---|---|
| Evaporation | liquid → vapor | about 2.5 × 10⁶ J/kg (600 cal/g) near 0 °C; 2.26 × 10⁶ J/kg (540 cal/g) at 100 °C | absorbs heat: cools (sweating, wet-bulb, evaporative cooling of downdrafts) |
| Condensation | vapor → liquid | same as evaporation | releases heat: warms (cloud growth, hurricane warm core) |
| Melting | ice → liquid | 3.34 × 10⁵ J/kg (80 cal/g) | absorbs heat (melting snow and hail cools the air) |
| Freezing | liquid → ice | 3.34 × 10⁵ J/kg | releases heat (freezing rain warms the surface slightly) |
| Sublimation | ice → vapor | about 2.83 × 10⁶ J/kg (680 cal/g) | absorbs heat |
| Deposition | vapor → ice | about 2.83 × 10⁶ J/kg | releases heat (ice-crystal growth, frost) |
The rule: going toward a more ordered phase (vapor → liquid → ice) releases heat; going toward a less ordered phase absorbs it. Sublimation's value is the sum of the other two (2.5 + 0.334 ≈ 2.83 × 10⁶ J/kg).
Two snowpack consequences tests ask about: a snowpack melts slowly in sunshine because of ice's large latent heat of fusion (melting 1 g takes as much energy as warming 1 g of water by 80 °C). And warm, humid air melts snow much faster than warm, dry air: water vapor condenses (or deposits) on the cold snow surface and releases latent heat into it, while in dry air the snow loses heat by sublimating and evaporating.
An adiabatic process is one in which no heat is added to or removed from a parcel of air; its temperature changes only because its pressure changes. A rising parcel moves into lower pressure, expands, does work pushing the surrounding air aside and cools (adiabatic cooling). A sinking parcel is compressed and warms (adiabatic warming, also called compressional heating). Adiabatic cooling does not mean the air was heated or cooled from outside; that is a common true-false trap. Rising air is the only way the atmosphere cools enough to make clouds and rain in bulk.
Humidity: how much water vapor is in the air
Humidity has several measures because tests (and forecasters) need different ones for different jobs. Learn each by its definition and units.
| Quantity | Definition | Typical units | Changes when air warms or cools (no vapor added)? |
|---|---|---|---|
| Vapor pressure () | The part of the air pressure exerted by water-vapor molecules | hPa (mb) | No (except for the small change when pressure changes) |
| Saturation vapor pressure () | The vapor pressure at saturation; depends only on temperature | hPa | Yes: rises steeply with temperature |
| Mixing ratio () | Mass of vapor per mass of dry air | g/kg | No: it is conserved as unsaturated air rises or sinks |
| Saturation mixing ratio () | The mixing ratio at saturation at that temperature and pressure | g/kg | Yes |
| Specific humidity () | Mass of vapor per mass of all the air (dry air plus vapor); almost equal to | g/kg | No |
| Absolute humidity () | Mass of vapor per volume of air (vapor density) | g/m³ | Yes, a little: expanding air spreads the same vapor over more volume |
| Relative humidity (RH) | Vapor present compared with saturation: or | % | Yes: falls when air warms, rises when it cools |
| Dew point () | Temperature to which air must be cooled, at constant pressure and vapor content, to become saturated | °C, °F | No: it measures the actual vapor content |
| Frost point | Same as dew point but for saturation over ice (used below 0 °C); slightly higher than the dew point | °C | No |
| Dew-point depression | °C | Yes; 0 means saturated | |
| Wet-bulb temperature () | Lowest temperature air can be cooled to by evaporating water into it | °C | Yes; always between and |
Saturation is the equilibrium in which as many water molecules condense onto a water surface as evaporate from it. "Air holds water" is shorthand: the vapor's capacity really depends on temperature, not on the air itself, but the shorthand is what tests use.
Saturation vapor pressure rises steeply with temperature (the Clausius-Clapeyron relation), by about 7% per °C, so it roughly doubles for every 10 °C of warming. Warm Gulf air at 25 °C can carry more than five times the vapor of air at 0 °C. This is why tropical air fuels the heaviest rain and why a warming atmosphere supports heavier downpours. It also explains winter: very cold air contains very little vapor, so even a strongly lifted −15 °C air mass can wring out only a small amount of water. Heavy snowstorms therefore usually need air near or a few degrees below freezing, often fed by moisture from a warm sea or a lake; bitter arctic outbreaks bring fine, light snow (it is fluffy, with high snow-to-liquid ratios, but the water content is small).
ReferenceSaturation values of water vapor· 11 rows
at 1000 hPa (near sea level) and at 850 hPa (about 1.5 km). Values computed from the Magnus formula below; they are what the dashed mixing-ratio lines on a Stüve or Skew-T show.
No rows match.
| T (°C) | (hPa) | at 1000 hPa (g/kg) | at 850 hPa (g/kg) |
|---|---|---|---|
| −20 | 1.3 | 0.8 | 0.9 |
| −10 | 2.9 | 1.8 | 2.1 |
| 0 | 6.1 | 3.8 | 4.5 |
| 5 | 8.7 | 5.5 | 6.4 |
| 10 | 12.3 | 7.7 | 9.1 |
| 15 | 17.0 | 10.8 | 12.7 |
| 20 | 23.4 | 14.9 | 17.6 |
| 25 | 31.7 | 20.3 | 24.1 |
| 30 | 42.5 | 27.6 | 32.7 |
| 35 | 56.3 | 37.1 | 44.1 |
| 40 | 73.9 | 49.7 | 59.3 |
Many textbook problems round these to "7 g/kg at 10 °C, 14 g/kg at 20 °C, 28 g/kg at 30 °C", the doubling rule in action.
How RH and dew point respond. Adding vapor (evaporation from a lake, a moist wind, transpiration) raises the vapor pressure, the mixing ratio, the dew point and the RH. Warming the air without adding vapor lowers RH but leaves the dew point unchanged; cooling raises RH until the air reaches its dew point. So on a calm day with no change in air mass, RH is highest near sunrise (the coldest time) and lowest in mid-afternoon, while the dew point stays nearly constant. A higher RH means a smaller gap between temperature and dew point, not a larger one. Because the dew point tracks the actual moisture, forecasters use it, not RH, to judge severe-storm fuel: surface dew points in the 60s °F (about 16 °C and above) are the usual threshold for robust spring severe weather in the Plains, and 70s °F are tropical. A dew point of 27 °F means very dry air whatever the RH.
The dew point as a floor for the overnight low. On a clear, calm night the ground and the air above it cool by radiation, but once the air cools to its dew point, dew (or frost) and fog start forming and release latent heat, so the temperature falls much more slowly after that. The evening dew point is therefore a good first guess for the minimum temperature. Dry air (a low dew point) also contains little water vapor, the main greenhouse gas near the ground, so more infrared escapes to space: deserts and dry air masses cool fastest at night and have the largest day–night temperature range, while humid nights stay warm. Clouds and wind both slow nighttime cooling.
Dew, frost and frozen dew. If a surface cools to a dew point above 0 °C, liquid dew forms; if that dew later freezes as the temperature keeps falling, it is frozen dew (clear beads of ice). Frost (white, feathery ice crystals) forms by deposition directly from vapor when the surface cools to a frost point below 0 °C. The dew point can never be higher than the air temperature; at saturation the two are equal, and in a cloud a rising parcel's dew point falls along with its temperature.
Precipitable water (PW) is the depth of liquid water you would get if all the vapor in a column of air condensed, usually given in inches or millimeters. It is computed by integrating the humidity from a radiosonde sounding, or estimated from satellite sounders and microwave instruments (and from GPS signal delay). Values above about 1.5–2 in mark the very moist air masses that produce flash floods.
What controls the evaporation rate. Water evaporates faster when (1) the water and air are warmer (more molecules have enough energy to escape), (2) the air is drier (a larger gap between the saturation vapor pressure at the water surface and the vapor pressure of the air), (3) the wind is stronger (it carries away the moist layer next to the surface and brings in drier air), and (4) the exposed surface area is larger. Evaporation stops (net) when the air is saturated. Coastal vs inland humidity: places near a warm ocean or large lake have a constant supply of evaporated water, so their dew points and humidity are higher (and their temperature range smaller) than places deep in a continental interior or downwind of mountains, far from any moisture source; that is the c-versus-m difference in air masses on a local scale.
Wet-bulb temperature and the sling psychrometer. A psychrometer has two thermometers. The dry bulb reads the air temperature; the wet bulb is covered with a wet cloth wick. A sling psychrometer is whirled (or a fan blows air past it) so that water evaporates from the wick, absorbing latent heat and cooling the bulb. The drier the air, the faster the evaporation and the larger the wet-bulb depression (). In saturated air nothing net evaporates and the two readings are equal. You then look up RH or dew point in a psychrometric table using the dry-bulb temperature and the depression. The wet-bulb temperature always lies between the dew point and the air temperature, and all three are equal at saturation. A hygrometer is any humidity instrument; hair and electronic (capacitive) hygrometers read RH directly.
ReferenceRelative humidity (%) from a psychrometer near sea level· 7 rows
Rows: dry-bulb temperature. Columns: wet-bulb depression in °C. Computed for 1013 hPa; tables printed for other pressures differ by a few percent, so use the table your test supplies when it gives one.
No rows match.
| Dry bulb | 1 | 2 | 3 | 4 | 5 | 6 | 8 | 10 |
|---|---|---|---|---|---|---|---|---|
| 5 °C | 86 | 72 | 58 | 45 | 32 | 19 | — | — |
| 10 °C | 88 | 76 | 65 | 54 | 44 | 33 | 14 | — |
| 15 °C | 90 | 80 | 70 | 61 | 52 | 44 | 27 | 12 |
| 20 °C | 91 | 83 | 74 | 66 | 59 | 51 | 37 | 24 |
| 25 °C | 92 | 84 | 77 | 70 | 63 | 57 | 44 | 33 |
| 30 °C | 93 | 86 | 79 | 73 | 67 | 61 | 50 | 39 |
| 35 °C | 93 | 87 | 81 | 75 | 69 | 64 | 54 | 44 |
Air pressure
Air pressure is the force per unit area exerted by the weight of the air above a point (equivalently, by air molecules striking a surface). It is measured with a barometer:
- A mercury barometer (Torricelli, 1643) is a glass tube, sealed at the top, standing in a dish of mercury. The air pushing on the dish holds the mercury column up; standard pressure supports 760 mm (29.92 in) of mercury. Mercury is used because it is dense; a water barometer would need a column about 10 m tall.
- An aneroid barometer uses a sealed, partly evacuated metal capsule that flexes in and out as pressure changes, moving a needle; it contains no liquid. An altimeter is an aneroid barometer calibrated to read altitude, and a barograph is an aneroid that draws pressure against time.
- Automated stations (ASOS) use electronic pressure sensors.
| Unit | Standard sea-level pressure | Conversion |
|---|---|---|
| hectopascal (hPa) | 1013.25 hPa | 1 hPa = 100 Pa |
| millibar (mb) | 1013.25 mb | 1 mb = 1 hPa exactly |
| inches of mercury (inHg) | 29.92 inHg | 1 inHg = 33.86 hPa |
| millimeters of mercury (mmHg, torr) | 760 mmHg | 1 mmHg = 1.333 hPa |
| kilopascal (kPa) | 101.325 kPa | 1 kPa = 10 hPa |
| pounds per square inch (psi) | 14.7 psi | 1 psi = 68.95 hPa |
| atmosphere (atm) | 1 atm | 1 atm = 1013.25 hPa |
Typical sea-level values run from about 980 to 1040 hPa. Strong winter highs exceed 1050 hPa; deep winter lows and hurricanes go below 960 hPa, and the strongest hurricanes approach 880 to 900 hPa (about 26 to 26.6 inHg).
Pressure and height. Pressure falls with height because there is less air above you. The decrease is roughly exponential: pressure about halves every 5.5 km, so the 500 hPa surface sits near 5.5 km and about half the atmosphere's mass lies below it. On the summit of Mount Everest (8,849 m) the pressure is only about a third of sea level, roughly 330–340 hPa, well below 500 hPa. Near the ground the drop is about 1 hPa for every 8 m (about 1 inHg per 1,000 ft). Warm air columns are less dense, so a given pressure level sits higher in warm air than in cold air; this is the root of the upper-level highs and lows on upper-air charts.
Station pressure versus sea-level pressure. A barometer reads station pressure, the actual pressure at the station's elevation. Denver's station pressure is around 830 to 840 hPa on an ordinary day, which says nothing about storms; it only reflects the city's altitude. To compare stations, each reading is reduced to sea level by adding the weight of an imaginary air column down to sea level. Sea-level pressure is what appears on surface maps and station models, and isobars are drawn from it, normally every 4 hPa on U.S. maps. The altimeter setting in a METAR (for example A2992 = 29.92 inHg) is a related sea-level-corrected value used by pilots; decoding it is covered in Surface maps, station models and METAR.
Rising and falling pressure. Falling pressure usually means an approaching low or trough with clouds, wind and precipitation; rising pressure means an approaching high with clearing. A very rapid fall (24 hPa or more in 24 hours at 60° latitude, scaled down at lower latitudes, about 18 hPa at 40°) is bombogenesis; see Severe winter storms.
Lifting mechanisms and the storm ingredients
Air cools enough to form clouds and precipitation mainly by rising. There are four ways to lift it:
| Lifting mechanism | How the air is lifted | Typical weather |
|---|---|---|
| Convection (convective lifting) | The sun heats the ground unevenly; warm, buoyant bubbles (thermals) rise on their own | Afternoon cumulus and air-mass thunderstorms; isolated storms in unstable air |
| Orographic | Wind forces air up a mountain slope | Windward rain and snow, rain shadow on the lee side, upslope storms |
| Frontal | Warm, less dense air is forced up over denser cold air at a front | Squall lines at cold fronts; widespread stratiform rain at warm fronts |
| Convergence | Air flowing together near the surface has nowhere to go but up | Florida sea-breeze storms, storms in lows, drylines, outflow boundaries, the ITCZ |
Every thunderstorm needs three ingredients: moisture (to form cloud and release latent heat), instability (so a lifted parcel keeps rising on its own) and lift (a trigger to start it rising). Severe and long-lived storms such as supercells and squall lines need a fourth: vertical wind shear, which organizes the storm. Questions often ask which factor is not needed: low (weak) shear and a strong ridge of high pressure are the usual wrong answers.
Pressure, wind and global circulation
Wind is air moving from higher toward lower pressure, bent by Earth's rotation and slowed by friction. Those three forces explain the spin of every storm, the wind belts of the planet, and why weather in the United States moves from west to east.
The forces that make the wind
Pressure-gradient force. Air pressure differs from place to place mainly because of uneven heating: warm air columns expand and cold ones contract, which creates pressure differences across a map. The PGF pushes air from high toward low pressure, at right angles to the isobars, and its strength is proportional to how fast pressure changes with distance (the pressure gradient). On a map, tightly packed isobars mean strong winds; widely spaced ones mean light winds. The PGF is the only force that can start air moving; all the others only modify it.
Coriolis effect. Earth rotates under moving air, so to an observer on the ground a freely moving object seems to curve. In the Northern Hemisphere, wind and ocean currents are deflected to the right of their direction of travel; in the Southern Hemisphere, to the left. The effect is an apparent force that arises because we measure motion in a rotating frame of reference. Its strength depends on two things: the speed of the moving air (no motion, no deflection) and the sine of the latitude (zero at the equator, largest at the poles). Because it is always at right angles to the motion, it changes the direction of the wind but not its speed, so it does no work on the air (it adds or removes no kinetic energy). Consequences that tests ask about:
- Tropical cyclones almost never form within about 5° of the equator, because there is too little Coriolis effect to start them spinning.
- Ocean gyres, Ekman transport, the trade winds' easterly direction and the westerlies all exist because of the Coriolis effect. Without it, surface wind would blow straight from high to low and storms could not organize their spin.
- It is far too weak to decide which way a sink or bathtub drains; that depends on the shape of the basin and leftover motion in the water. Coriolis matters only for motions that last hours or more over tens to thousands of kilometers.
Friction. In the lowest kilometer or so (the friction layer or planetary boundary layer), the ground drags on the air. Friction slows the wind; a slower wind has a weaker Coriolis deflection, so the PGF wins and the wind turns across the isobars toward lower pressure, at about 10° to 20° over the smooth ocean and roughly 30° (20° to 45°) over rough land. That is why surface winds spiral into lows and out of highs, and why winds are usually stronger over water and on hilltops than in a forest or city. Friction over land is also one reason a landfalling hurricane's winds weaken, although losing its warm-ocean fuel matters more.
Balanced winds: geostrophic and gradient
Air set moving by the PGF is turned by Coriolis until the two forces point in opposite directions and balance. The result, the geostrophic wind, blows parallel to straight isobars, with low pressure on the left in the Northern Hemisphere. It is a very good approximation above the friction layer (roughly above 1 km), which is why upper-air winds follow the height contours on a 500 hPa chart and why the spacing of the contours gives the wind speed. When the isobars curve, a third ingredient (the centripetal acceleration of curved motion) enters, and the balanced flow parallel to curved isobars is the gradient wind. For the same pressure gradient, the gradient wind is slower than geostrophic around a low (subgeostrophic) and faster around a high (supergeostrophic). Balance also limits how steep the pressure gradient can get near the center of a high, so highs have weak gradients and light winds, while the strongest gradients and winds are found around lows. In very small, intense vortices such as tornadoes, the spin is so fast that Coriolis is negligible and the PGF is balanced by the centripetal term alone (cyclostrophic flow), so tornadoes can rotate either way (although nearly all Northern Hemisphere tornadoes turn counterclockwise because their parent storm does).
Buys Ballot's law turns this into a field rule: in the Northern Hemisphere, stand with your back to the wind and low pressure is on your left (high on your right). In the Southern Hemisphere it is the reverse.
Winds around highs and lows
| Northern Hemisphere | Southern Hemisphere | Vertical motion | Typical weather | |
|---|---|---|---|---|
| Low (cyclone) | counterclockwise, spiraling inward | clockwise, inward | surface convergence, rising air, divergence aloft | clouds, precipitation, storms, wind |
| High (anticyclone) | clockwise, spiraling outward | counterclockwise, outward | sinking air (subsidence), surface divergence, convergence aloft | clear or fair skies, light winds, calm nights, inversions, haze |
"Cyclonic" means turning the same way as Earth (counterclockwise in the Northern Hemisphere) and is associated with lows; "anticyclonic" is the opposite. Sinking air in a high warms by compression and dries, which dissolves clouds; an overcast sky is not a normal characteristic of an anticyclone, but a persistent high brings heat waves in summer, stagnant air and pollution, radiation fog and frost in winter, and drought if it stalls. A high also tends to be where air masses form, because air sits still over one region long enough to take on its properties.

Linking the surface to the upper air. A surface low can only deepen if air is removed from the column above it faster than friction-driven convergence pours air in at the bottom. That removal is divergence aloft, found downstream (east) of upper troughs and in parts of jet streaks. Where air converges aloft, the column gains mass, air sinks and a surface high builds; that happens upstream (west) of upper troughs, under the eastern side of upper ridges. So a surface low sits east of (ahead of) the upper trough and a surface high sits under the convergence west of it, and a mid-latitude low tilts westward with height while it is strengthening. When the low ends up directly beneath the upper low (vertically stacked), the divergence above it disappears and it begins to weaken.
Troughs and ridges. A trough is an elongated area of low pressure (or low heights aloft), drawn as a dashed line on surface maps; a ridge is an elongated area of high pressure. Upper ridges hold warmer, less dense air and bring fair weather and warmth; upper troughs hold colder air and bring clouds, precipitation and storms, which favor the east side of the trough.
Global circulation: from one cell to three
The equator receives more solar energy than the poles, and the atmosphere (with the ocean) carries the surplus poleward. In the 1700s George Hadley proposed a single-cell model: in each hemisphere, warm air rises at the equator, flows aloft to the pole, sinks and returns along the surface. The simplified textbook version of that model assumes a non-rotating Earth with a uniform surface. It fails because Earth rotates: poleward-moving air aloft is turned eastward by the Coriolis effect and, by about 30° latitude, is moving almost due east, piles up and sinks. A single cell would also give northerly surface winds everywhere in the Northern Hemisphere, which is not what we observe. The three-cell model fixes this.

- Hadley cell (0° to 30°). A thermally direct cell driven by intense equatorial heating. Air rises in the Intertropical Convergence Zone (ITCZ), where the trade winds of the two hemispheres meet; the result is a belt of thunderstorms and the rainforests. Aloft it flows poleward (the "antitrades"), sinks near 30° and returns toward the equator at the surface as the trade winds, turned by Coriolis to blow from the northeast in the Northern Hemisphere and the southeast in the Southern. The calm, rainy ITCZ is also called the doldrums. On average the ITCZ lies a few degrees north of the equator, because the Northern Hemisphere is slightly warmer (ocean currents carry heat north across the equator, and it has more land), and it migrates with the sun (farther north in July).
- Subtropical highs (about 30°). Sinking, warming, drying air makes a belt of high pressure, the horse latitudes (roughly 30° to 35°), with light winds and clear skies. The world's great hot deserts (Sahara, Arabian, Australian, Kalahari, Sonoran) lie under them.
- Ferrel cell (30° to 60°). A thermally indirect cell, turning like a gear between the other two, not driven directly by heating. Its surface flow is poleward, turned to blow from the west: the prevailing westerlies (from the southwest in the Northern Hemisphere, northwest in the Southern). In reality this zone is dominated by migrating highs, lows and fronts rather than a smooth cell.
- Subpolar low and polar front (about 60°). Mild westerly air meets cold polar air and rises along the polar front, the birthplace of mid-latitude cyclones.
- Polar cell (60° to 90°). A direct cell: cold, dense air sinks over the pole into the polar high, then flows equatorward at the surface as the polar easterlies. It exists in both hemispheres.
| Latitude band | Pressure | Vertical motion | Surface wind (Northern Hemisphere) | Climate |
|---|---|---|---|---|
| 0° to 5° (ITCZ, doldrums) | low | rising | light, variable | rainforest, daily thunderstorms |
| 5° to 30° | — | — | northeast trades (southeast in SH) | steady winds; hurricanes ride the trades west |
| about 30° (horse latitudes) | subtropical high | sinking | light, variable | deserts, dry summers |
| 30° to 60° | — | — | westerlies from the southwest (northwest in SH) | changeable weather, fronts, the United States |
| about 60° (polar front) | subpolar low | rising | converging | stormy, cloudy |
| 60° to 90° | — | — | polar easterlies | cold, dry |
| 90° (pole) | polar high | sinking | — | polar desert |

Semi-permanent pressure centers. Because continents and oceans heat differently, the pressure belts break into cells that appear on every seasonal map.
| Center | Where | Strongest | What it does |
|---|---|---|---|
| Bermuda-Azores High (North Atlantic subtropical high) | subtropical North Atlantic (near the Azores in winter, toward Bermuda in summer) | summer | its south side's trade winds carry hurricanes west; its west side pumps humid Gulf and Atlantic air into the eastern U.S.; storms recurve around its western edge |
| Pacific (Hawaiian) High | subtropical North Pacific | summer | dry summers and the marine-layer inversion in California; blocks Pacific storms in summer |
| Icelandic Low | near Iceland and southern Greenland | winter | the average of many storms; steers storms into Europe |
| Aleutian Low | Gulf of Alaska and Aleutians | winter | Pacific storm track into the Pacific Northwest and Alaska |
| Siberian High | Siberia and Mongolia | winter only | the coldest, densest surface air in the Northern Hemisphere and the highest sea-level pressures on Earth; source of cold outbreaks in Asia (the winter monsoon) |
| Canadian (North American) High | northern Canada | winter only | source of cP and cA outbreaks into the U.S. |
| Southwest (desert) thermal low | Arizona, northern Mexico | summer | draws moisture north for the North American monsoon thunderstorms |
The seasonal reversal of winds between a summer continental low and a winter continental high is a monsoon; the Asian monsoon is the largest, and the North American monsoon brings July–September thunderstorms to the desert Southwest. The polar vortex is the large area of low pressure and very cold air circling each pole, strongest in winter; when it is disturbed, lobes of arctic air spill south into the mid-latitudes.
Why U.S. weather moves west to east. The contiguous United States lies in the belt of the prevailing westerlies, and the jet stream above it blows from west to east. Highs, lows, fronts and storm complexes are steered by that flow, so tomorrow's weather is usually upstream today, to the west. Mid-latitude lows usually travel northeast, because they form on the downstream (east) side of upper troughs where the flow is from the southwest. Exceptions prove the rule: hurricanes in the tropics move west in the trades until they reach the westerlies and recurve, and backdoor cold fronts push in from the northeast.
Soundings and stability
A sounding is the vertical profile of temperature, dew point and wind measured by a radiosonde (a balloon-borne instrument package launched worldwide at 00Z and 12Z). Storm forecasting depends on what a rising parcel of air does compared with the air around it. A sounding is plotted on a thermodynamic diagram with temperature on one axis and pressure (as a stand-in for height) on the other; it shows temperature, dew point and wind, not precipitation.
Parcels and lapse rates
Picture a parcel, a balloon-sized blob of air that does not mix with its surroundings and adjusts its pressure instantly to that of the environment. Lifted, it expands and cools adiabatically. While unsaturated it cools at the dry adiabatic lapse rate (DALR), about 9.8 °C per km (5.5 °F per 1,000 ft); its mixing ratio stays constant, so its dew point falls only slowly, about 2 °C per km, and the gap between temperature and dew point closes by about 8 °C per km. Once the parcel reaches its dew point it is saturated and condensation begins. From then on, the latent heat released by condensation offsets part of the expansion cooling, so it cools more slowly at the moist (saturated) adiabatic lapse rate (MALR, SALR), roughly 4 to 7 °C per km depending on temperature: near 4 °C/km in very warm, moist low-level air (lots of vapor condensing), approaching the dry rate in very cold air aloft (little vapor left). A common round value is 6 °C/km (about 3.3 °F per 1,000 ft). Sinking air warms at the dry rate unless it contains cloud droplets to evaporate.
The actual temperature change with height in the surrounding air is the environmental lapse rate, measured by the sounding. It varies from day to day and layer to layer; that is the whole point of launching balloons.
| Stability class | Lapse-rate order (least to greatest) | What a lifted parcel does | Typical clouds and weather |
|---|---|---|---|
| Absolutely stable | ELR, MALR, DALR (or an inversion) | colder than surroundings whether dry or saturated; sinks back | clear, or flat stratus layers; fog, haze and smog trapped near the ground |
| Neutral | ELR equals the parcel's rate | stays wherever it is put | — |
| Conditionally unstable | MALR, ELR, DALR | stable until lifted past saturation, then becomes buoyant if lifted far enough | cumulus growing into cumulonimbus once a trigger lifts air to the LFC |
| Absolutely unstable | MALR, DALR, ELR | warmer than surroundings immediately; rises on its own | usually only in a thin layer next to sun-baked ground (superadiabatic layer); dust devils, thermals |
Potential temperature () is the temperature a parcel would have if brought dry-adiabatically to 1000 hPa. It is constant along a dry adiabat, so dry adiabats are lines of constant , and comparing between levels is a quick stability test: increasing with height means stable, decreasing means unstable.
How latent heat fuels storms. Condensation inside a cloud releases latent heat, which keeps the rising parcel warmer than its surroundings, so a moist parcel can stay buoyant through a layer that would stop a dry one. That is why moisture is an ingredient of instability, not just of rain. Raising the low-level dew point (more evaporation and transpiration, a southerly flow off the Gulf) lowers the LCL and makes the parcel follow a warmer moist adiabat, increasing CAPE. Once a storm is going, its own condensation keeps feeding the updraft, which is why storms triggered by a mountain or front can drift away from the trigger and live on.
Conditional and convective instability. Most severe-weather soundings are conditionally unstable: stable for unsaturated air, unstable once air is saturated and lifted far enough. A related set-up is convective (potential) instability: a layer with warm, moist air at the bottom and very dry air on top. If the whole layer is lifted (by a front or dryline), the moist bottom saturates and cools slowly while the dry top cools at the dry rate, so the layer's lapse rate steepens until it overturns violently. The Plains pattern of Gulf moisture under dry air from the Mexican plateau is the classic case.
Entrainment is the mixing of surrounding air into a cloud or updraft through its edges. Entrained environmental air is usually drier and cooler; some cloud water evaporates into it, which cools the parcel and weakens its buoyancy. Entrainment is why real updrafts are weaker than parcel theory predicts, why narrow cumulus in dry air die quickly, and why dry air entrained into a storm's downdraft (through evaporation) can intensify downbursts.
Temperature inversions
An inversion is a layer where temperature increases with height, the most stable situation there is: a parcel pushed up into it becomes colder than its new surroundings and sinks back. Inversions act as lids.
| Inversion type | How it forms | Where and when | Effects |
|---|---|---|---|
| Radiation (nocturnal, surface) | The ground radiates heat to space at night and chills the air touching it; air above stays warmer | Clear, calm, dry nights, long winter nights; strongest just before sunrise; deepest in valleys where cold air drains | Radiation fog, frost, trapped smoke and pollution, morning calm; breaks up as the sun heats the ground |
| Subsidence | Air sinking in a high-pressure system warms by compression above a cooler, often marine, surface layer | Under subtropical and other highs, often a kilometer or two up; the marine layer of California; the trade-wind inversion over the subtropical oceans (near 20° latitude), whose base caps the trade cumulus and which weakens toward the equator | Persistent haze and smog (Los Angeles basin), stratus decks, suppressed storms, heat waves |
| Frontal | Warm air overrides cold air at a front | Ahead of warm fronts and behind cold fronts | Layered clouds; a warm layer over cold surface air gives freezing rain or sleet |
| Elevated mixed layer (the cap) | Hot, dry air heated over high terrain (the Mexican plateau, desert Southwest) flows out over moist Gulf air | Spring over the southern and central Plains | Holds storms back while heat and moisture build; storms that finally break through are explosive |
| Turbulence and marine | Mixing in a windy layer, or warm air over a cool ocean | Coasts, windy nights | Low clouds, fog, trapped pollutants |
The stratosphere above the tropopause is itself one great inversion, which is why thunderstorm tops flatten into anvils. Inversions also bend radar beams back toward the ground (anomalous propagation) and set up low-level wind shear at night.
The cap. A warm, dry inversion a kilometer or two up can hold storms back all day while heat and moisture build underneath; if a front or dryline breaks the cap in late afternoon, the storms that form are often explosive. A weak to moderate cap is actually helpful for big tornado days: it prevents dozens of small storms from forming early and competing, so the few that break through have the energy to themselves. A cap that is too strong (for example a 700 hPa temperature above about 10 to 12 °C over the Plains) usually means no storms at all.
Stüve diagrams (all levels)
A Stüve diagram plots temperature on the horizontal axis against pressure (scaled so dry adiabats are straight lines) on the vertical axis. Pressure, not height, is used because the radiosonde measures pressure directly, pressure falls smoothly with height, and the physics of rising parcels is simplest in pressure. A Stüve carries five families of lines:
| Line family | Appearance (typical) | Meaning |
|---|---|---|
| Isotherms | vertical straight lines | constant temperature |
| Isobars | horizontal lines, labeled in hPa (1000, 850, 700, 500, 300 …) | constant pressure |
| Dry adiabats | straight lines sloping up to the left (often solid green) | path of an unsaturated parcel; constant potential temperature |
| Moist (saturated) adiabats | curved lines, steep near the bottom, bending toward the dry adiabats aloft (often dashed) | path of a saturated parcel |
| Saturation mixing-ratio lines | nearly vertical dashed lines labeled in g/kg | path of the dew point of a lifted unsaturated parcel; read humidity from them |
You read it by following lines:
- Where the temperature and dew-point traces nearly touch, the layer is saturated: that is cloud. Where they are far apart, the air is dry.
- Where the temperature trace bends to the right with height, there is an inversion.
- Compare the slope of the temperature trace with the dry and moist adiabats to judge stability layer by layer: a trace leaning farther left than the moist adiabats is unstable for saturated air; one leaning farther left than the dry adiabats is absolutely unstable.
- Wind barbs on the side show shear: speed increasing and direction turning with height.
- The dew point read off the mixing-ratio lines gives the mixing ratio; the mixing-ratio line through the temperature gives the saturation mixing ratio; their ratio is the RH.
State & National only: Skew-T, LCL and CAPE
A Skew-T/log-p diagram carries the same information with the isotherms tilted 45° to the right, so the traces spread out and the area between parcel and environment is easier to see. The skills are the same as on a Stüve. Dry and moist adiabats are not parallel on a Skew-T: the dry adiabats cross the moist adiabats at a wide angle near the bottom of the diagram and converge with them aloft.
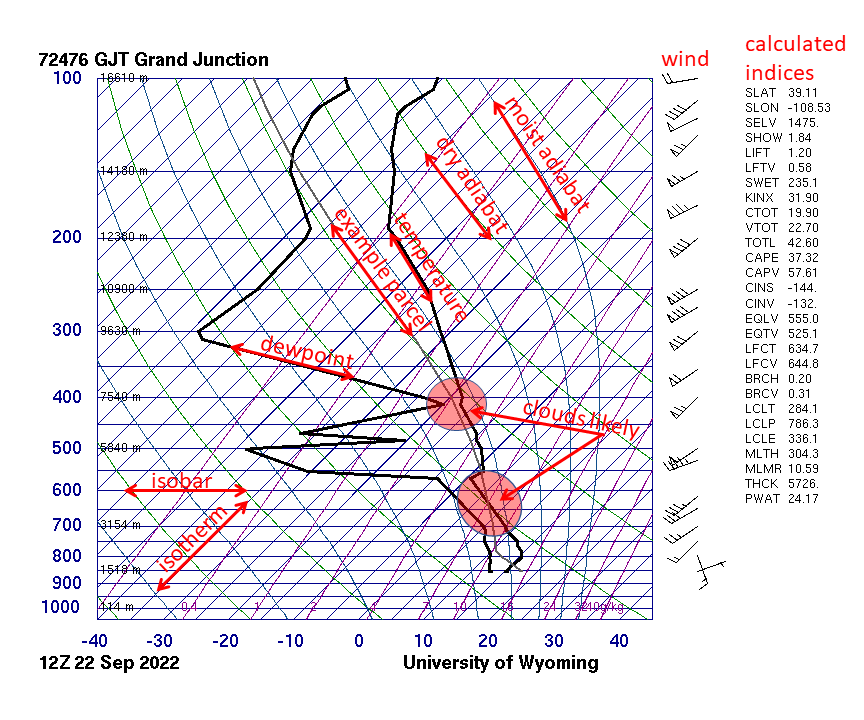
The lifting condensation level (LCL) is where a lifted surface parcel cools to its dew point and cloud forms; it is the cloud-base height. On a diagram, follow the dry adiabat up from the surface temperature and the mixing-ratio line up from the surface dew point; they cross at the LCL. Above the LCL, the parcel follows a moist adiabat, so its path changes slope there. Low LCLs (under about 1,000 m) are associated with tornadic supercells because the downdrafts are less cold.
Convective available potential energy (CAPE) is the energy a rising parcel gains from being warmer than its surroundings, from the level of free convection (LFC), where it first becomes warmer, to the equilibrium level (EL), where it no longer is. On a Skew-T it is the area between the parcel path and the environmental trace. Negative area below the LFC is convective inhibition (CIN), the cap; CIN is the energy that must be supplied by lift to get the parcel to its LFC. CAPE is always zero or positive; CIN is a negative quantity (often quoted as a positive number of J/kg of inhibition). Roughly, CIN under about 50 J/kg is easily overcome by a front or dryline, and CIN above about 200 J/kg usually prevents storms. The EL is close to the height where the anvil spreads out; an overshooting top marks an updraft strong enough to coast past it.
Stability indices summarize a sounding in one number.
| Index | How it is computed | Reading |
|---|---|---|
| Lifted index (LI) | at 500 hPa, for a surface (or mixed-layer) parcel lifted to 500 hPa | positive: stable; 0 to −3: marginally unstable; −3 to −6: moderately unstable; below −6: very unstable (severe storms likely if lifted) |
| K-index | , all in °C | rewards a steep 850–500 lapse rate and deep moisture at 850 and 700; above about 30 means a good chance of (mostly non-severe, heavy-rain) thunderstorms |
| CAPE | area between parcel and environment from LFC to EL | see above |
| CIN | negative area below the LFC | the strength of the cap |
Observing severe weather
Every forecast starts with observations. The rules list the main observing platforms, and questions ask what each one measures, how it works, and what it cannot see. A useful split: in situ instruments touch the air they measure (thermometers, radiosondes, buoys), while remote sensors measure from a distance using electromagnetic radiation. Remote sensors are either active, sending out their own energy and timing the echo (radar, lidar, wind profilers, sodar, scatterometers), or passive, recording energy that is already there (satellite imagers measuring reflected sunlight or emitted infrared, radiometers).
| Platform | What it measures | Strength | Limitation |
|---|---|---|---|
| ASOS (Automated Surface Observing System) | Temperature, dew point, wind, pressure, visibility, sky cover and precipitation at airports, run jointly by the NWS, FAA and Defense Department | Standard, continuous, reported in METAR code | Stations are tens of kilometers apart, so small storms slip between them |
| Mesonets | The same surface variables on a dense regional network (for example, the Oklahoma Mesonet's roughly 120 sites), often plus soil moisture and solar radiation | Catch gust fronts, drylines and outflow boundaries that ASOS misses; report every few minutes | Regional coverage only |
| Radiosondes | Temperature, humidity and pressure from a balloon, with winds from its drift; launched twice a day at 00 and 12 UTC | The only routine view of the vertical profile | Only twice a day at about 90 U.S. sites |
| Buoys | Air and sea temperature, wind, pressure and waves over open water | Track hurricanes and nor'easters at sea; cheaper and safer than weather ships | Fixed points; can be damaged |
| Aircraft | Commercial aircraft report temperature and wind; Hurricane Hunter aircraft fly into storms and drop dropsondes | Direct measurements inside hurricanes | Not continuous |
| Doppler radar | Precipitation intensity, motion toward or away from the radar, and particle type | Sees inside storms every few minutes | The beam rises with distance, so it overshoots low-level features far from the radar |
| Satellites | Visible, infrared and water-vapor imagery | Covers oceans and whole continents; first detection of tropical storms | Sees mostly cloud tops, not what happens under them |
| Storm spotters | Eyewitness reports of tornadoes, funnel clouds, wall clouds, hail size, wind damage and flooding | Ground truth: the only way to confirm what a tornado is doing at the surface besides damage | Limited by darkness, rain and terrain |

Weather instruments
Tests love instrument matching: "an instrument that measures humidity", "what does a disdrometer measure", "which liquid is in a barometer". Learn each instrument's variable, its working principle and its unit.
Pressure. Mercury and aneroid barometers, altimeters and barographs are described under Air pressure. Electronic stations use pressure transducers. Rising pressure usually means clearing, drying weather (an approaching high); steadily or rapidly falling pressure means an approaching low or front and worsening weather.
Wind. An anemometer measures speed (cup, propeller or sonic types; see the table); a wind vane points into the wind, so it reports the direction the wind blows from. Sonic anemometers time ultrasonic pulses and have no moving parts, so they do not freeze or wear out.
Humidity. A hygrometer measures humidity. Old hair hygrometers use human hair, which lengthens as relative humidity rises; modern electronic sensors use a thin film whose electrical capacitance or resistance changes with moisture. The sling psychrometer (a dry bulb and an evaporatively cooled wet bulb) is explained, with its table and a worked example, under Humidity: how much water vapor is in the air. A dew-point hygrometer (chilled mirror) cools a mirror until dew forms on it and reads that temperature directly.
Precipitation. A standard rain gauge (the NWS 8-inch gauge) funnels rain into a narrow inner tube with one-tenth of the funnel's area, so the depth is magnified ten times and easy to read to 0.01 in. A tipping-bucket gauge funnels rain into a small seesaw bucket that tips every 0.01 in, and each tip sends an electronic pulse, so it records rainfall rate as well as total (long used at ASOS sites, many of which now also have an all-weather weighing gauge; it undercounts in very heavy rain and needs heating for snow). A weighing gauge weighs everything that falls, so it handles snow and hail. A snow board is a flat white board set on top of old snow and wiped clean after each measurement, so the depth of new snow can be measured with a ruler; it is the snow counterpart of the rain gauge. A disdrometer measures the size and fall speed of individual drops (laser or impact sensors), which tells the drop-size distribution and precipitation type.
Clouds, radiation and upper air. A ceilometer times a laser pulse to the cloud base. A wind profiler is a vertically pointing Doppler radar that senses tiny returns from turbulent fluctuations of the air's refractive index, giving winds at many heights every few minutes; low frequencies (about 50 MHz) reach highest, to about 20 km, with coarser vertical resolution, while about 915 MHz profilers cover only the lowest few kilometers in fine detail. Sodar does the same with sound.
Balloons and drops. A radiosonde is a small battery-powered instrument package carried by a hydrogen- or helium-filled balloon. It measures pressure, temperature and relative humidity (dew point is computed) and radios them to the ground as it rises at about 5 m/s; after roughly two hours, at about 30 to 35 km, the balloon bursts and the sonde parachutes down. A rawinsonde is a radiosonde that is also tracked (once by radio direction finding, now by GPS) so the drift gives wind speed and direction at every level; almost all modern soundings are rawinsondes. A dropsonde is a radiosonde dropped from an aircraft on a parachute, measuring the profile from the plane down to the sea surface; Hurricane Hunters use them in and around hurricanes. An ozonesonde adds an ozone sensor to a radiosonde. Radiosondes do not measure precipitation, cloud type or albedo. Before radio and GPS tracking, upper winds came from a pilot balloon (pibal): a small balloon with no instruments, filled to rise at a known rate and followed by eye through a theodolite, a surveying telescope that reads the balloon's elevation angle and azimuth every minute. The known rise rate gives the height, the angles give the horizontal position, and the change in position between readings gives wind speed and direction at each level (two theodolites at the ends of a baseline can triangulate the height directly). Pibals and theodolites are still used where radiosondes are unavailable, but they fail once the balloon enters cloud.
Who invented what. Tests sometimes match instruments to inventors: Galileo's thermoscope (about 1593), Torricelli's mercury barometer (1643), Fahrenheit's mercury thermometer (1714), Leon Battista Alberti's swinging-plate anemometer (about 1450; Leonardo da Vinci also sketched one), Thomas Romney Robinson's cup anemometer (1846), Horace-Bénédict de Saussure's hair hygrometer (1783), and Robert Watson-Watt's radar (1935), later adapted to watch storms.
Surface networks and people. ASOS (Automated Surface Observing System) is the NWS, FAA and Defense Department network of roughly 900 stations, mostly at airports; AWOS (Automated Weather Observing System) is a similar FAA or state-run system, usually at smaller airports and sometimes reporting fewer variables. Both issue METARs automatically. SKYWARN is the NWS volunteer storm-spotter program: trained private citizens, police, fire and emergency-management staff who report hail size, wind damage, funnel clouds, tornadoes and flooding. Spotters remain essential because radar cannot see the lowest part of a storm far from the radar, and a spotter report of a tornado on the ground is enough by itself for a tornado warning.
| Instrument | Measures | How it works | Usual unit |
|---|---|---|---|
| Thermometer (liquid-in-glass, electronic) | Air temperature | Liquid expands, or electrical resistance changes, with temperature | °F, °C |
| Mercury barometer | Air pressure | Air pressure supports a column of mercury | inHg, mmHg |
| Aneroid barometer | Air pressure | Sealed metal capsule flexes; levers move a needle | hPa (mb), inHg |
| Barograph | Pressure over time | Aneroid with a pen tracing on a rotating drum | hPa or inHg vs time |
| Altimeter | Altitude | Aneroid barometer calibrated in height | ft, m |
| Cup anemometer | Wind speed | Cups spin faster in stronger wind | kt, mph, m/s |
| Propeller (aerovane) anemometer | Wind speed and direction | Propeller on a vane that faces into the wind | kt and degrees |
| Sonic anemometer | Wind speed and direction | Times ultrasonic pulses between transducers; no moving parts | kt and degrees |
| Wind vane | Wind direction | Tail swings so the arrow points into the wind | degrees (direction from) |
| Hygrometer | Humidity | Hair length, or a film whose capacitance or resistance changes with moisture | % RH |
| Sling psychrometer | Relative humidity and dew point | Dry bulb vs evaporatively cooled wet bulb; tables convert the depression | °F or °C, then % RH |
| Standard rain gauge | Rainfall total | Funnel into a tube one-tenth the area (10× magnification) | in, mm |
| Tipping-bucket gauge | Rainfall total and rate | Small bucket tips every 0.01 in and sends a pulse | in, in/h |
| Weighing gauge | All precipitation incl. snow | Weighs the catch | in of liquid equivalent |
| Snow board | New snowfall depth | Flat board cleared after each measurement | in, cm |
| Disdrometer | Drop size and fall speed | Laser beam or impact sensor | mm, m/s |
| Ceilometer | Cloud-base height | Laser pulse timed to the cloud base | ft AGL |
| Transmissometer | Visibility (extinction of light) | Measures how much of a light beam survives a fixed path between a transmitter and a receiver; used at airports for runway visual range (RVR) | ft or m (RVR), statute miles |
| Forward-scatter visibility sensor | Visibility | Measures light scattered by fog, haze, rain or snow in a small sample volume; the ASOS visibility sensor | statute miles |
| Pyranometer | Incoming solar radiation | Thermopile heated by sunlight | W/m² |
| Wind profiler | Wind speed and direction with height | Vertical Doppler radar sensing refractive-index turbulence | kt or m/s by height |
| Radiosonde | Pressure, temperature, humidity aloft | Balloon-borne sensors radioed to the ground | hPa, °C, % |
| Rawinsonde | The radiosonde variables plus wind aloft | Radiosonde tracked by radio direction finding or GPS | adds kt and degrees |
| Dropsonde | Vertical profile below an aircraft | Radiosonde on a parachute | hPa, °C, %, kt |
| Lightning detection network | Location and time of strikes | Ground sensors pick up the radio waves from strikes and triangulate | strikes per area and time |
The Beaufort wind scale estimates wind force by eye, without an instrument, from its effects on the sea surface or on land. Admiral Francis Beaufort devised it for sailors in 1805; it runs from Force 0 to Force 12 and is still used in marine forecasts. Waves grow with wind speed, how long it blows (duration) and the open-water distance it blows over (fetch); long-period swell is the waves that have traveled away from the storm that made them.
| Force | Name | Speed (kt) | Speed (mph) | On land | At sea |
|---|---|---|---|---|---|
| 0 | Calm | under 1 | under 1 | Smoke rises vertically | Sea like a mirror |
| 1 | Light air | 1–3 | 1–3 | Smoke drifts; vanes do not move | Ripples, no crests |
| 2 | Light breeze | 4–6 | 4–7 | Wind felt on face; leaves rustle; vane moves | Small wavelets, glassy crests |
| 3 | Gentle breeze | 7–10 | 8–12 | Leaves and twigs in constant motion; light flags extend | Large wavelets; crests begin to break; scattered whitecaps |
| 4 | Moderate breeze | 11–16 | 13–18 | Raises dust and loose paper; small branches move | Small waves; fairly frequent whitecaps |
| 5 | Fresh breeze | 17–21 | 19–24 | Small trees in leaf sway | Moderate, longer waves; many whitecaps; some spray |
| 6 | Strong breeze | 22–27 | 25–31 | Large branches move; wires whistle; umbrellas hard to use | Large waves; white foam crests everywhere |
| 7 | Near gale | 28–33 | 32–38 | Whole trees move; hard to walk against the wind | Sea heaps up; foam blown in streaks |
| 8 | Gale | 34–40 | 39–46 | Twigs break off trees; walking is impeded | Moderately high waves; crests break into spindrift |
| 9 | Strong gale | 41–47 | 47–54 | Slight structural damage (shingles, chimney pots) | High waves; dense foam streaks; spray cuts visibility |
| 10 | Storm | 48–55 | 55–63 | Trees uprooted; considerable structural damage | Very high waves with overhanging crests; sea looks white |
| 11 | Violent storm | 56–63 | 64–72 | Widespread damage | Exceptionally high waves; visibility badly reduced |
| 12 | Hurricane force | 64 or more | 74 or more | Severe, widespread destruction | Air filled with foam and spray; sea completely white |
Force 8 starts at 34 kt, the same threshold as a tropical storm and a gale warning, and Force 12 starts at 64 kt (about 118–119 km/h), the hurricane threshold.
Doppler radar products
RADAR stands for RAdio Detection And Ranging. A weather radar is an active remote sensor: the antenna sends out a short pulse of microwave energy (radar waves are the short-wavelength end of the radio band), then switches to listening. Targets in the beam (raindrops, snowflakes, hail, but also insects, birds, dust and ground objects) scatter some energy back. Three things are measured from each pulse:
- Range: the time for the round trip. Because the pulse travels out and back at the speed of light, .
- Intensity (reflectivity): how much power comes back, which depends on the number and especially the size of the targets.
- Radial velocity: the Doppler shift, the small change in frequency (measured as a phase change from pulse to pulse) caused by targets moving toward or away from the antenna. Targets moving toward the radar return a slightly higher frequency, targets moving away a lower one. This is the one thing a Doppler radar measures that an older radar could not.
The U.S. network is NEXRAD, made of WSR-88D radars (Weather Surveillance Radar, 1988, Doppler; the D stands for Doppler). There are about 160 of them (roughly 159 operational sites run by the NWS, FAA and Air Force across the U.S. and overseas bases). They are S-band radars with a wavelength of about 10 cm (frequency about 2.7 to 3.0 GHz); this long wavelength is barely weakened by heavy rain, so the radar can see through one storm to the next. Each pulse lasts about 1.57 microseconds and the radar fires roughly 300 to 1,300 pulses per second; between pulses it listens, so in a whole hour it transmits for only about 7 seconds and listens for the remaining 59 minutes and 53 seconds. Peak transmitted power is about 750 kW (750,000 W); some NWS outreach pages quote about 450,000 W. Separate from NEXRAD, the FAA runs TDWR (Terminal Doppler Weather Radar), C-band (5 cm) radars at about 45 large airports, built to detect microbursts and wind shear near runways; airport surveillance radars for air-traffic control are a different network again.
The radar scans 360° at one elevation angle, tilts up, and repeats. The fixed set of tilts it runs is a volume coverage pattern (VCP): in severe weather a "precipitation mode" VCP sweeps about 14 elevation angles from 0.5° to 19.5° in about 4 to 5 minutes (faster with extra low-level rescans); in "clear-air mode" it uses fewer tilts and slower rotation for sensitivity to weak echoes such as light snow.
Reflectivity and the dBZ scale
The reflectivity factor is the sum of the sixth powers of the drop diameters in a unit volume, , in mm⁶/m³. The sixth power has a big consequence: one drop of 6 mm diameter returns as much as 64 drops of 3 mm (2⁶ = 64), so a few large drops or hailstones dominate the echo. Composition matters too: liquid water has a much higher dielectric factor than ice ( vs about 0.18), so a water drop returns about five times (about 7 dB) more power than an ice particle of the same size. That is why dry snow looks weak on radar, and why melting snowflakes (the bright band) and water-coated hail look so strong. Because ranges from about 0.001 mm⁶/m³ in fog to over 10⁷ in giant hail, a linear scale would be useless, so radar uses a logarithmic scale in decibels of Z (dBZ):

| dBZ | Usual color (NWS table) | Typical meaning |
|---|---|---|
| Below 5 to 15 | Blue-gray to light blue | Clear-air returns (insects, dust), drizzle, very light snow |
| 15 to 30 | Light to dark green | Light rain or moderate snow |
| 30 to 40 | Dark green to yellow | Moderate rain |
| 40 to 50 | Yellow to orange | Heavy rain; thunderstorm cores begin |
| 50 to 60 | Red | Very heavy rain, possibly small hail |
| 60 to 65 | Dark red to magenta | Very heavy rain and hail likely |
| Above 65 | Magenta, purple, white | Large hail almost certain |
Reflectivity products:
- Base reflectivity is the returned power from one tilt, usually the lowest (0.5°), in dBZ. More and larger targets mean higher dBZ: about 20 dBZ is light rain, 40 dBZ moderate to heavy rain, 50 to 60 dBZ very heavy rain, and values above about 60 dBZ usually mean hail.
- Composite reflectivity shows the highest value found anywhere in the vertical column above each point. It reveals hail cores aloft that the lowest tilt misses, but it hides the low-level structure (you cannot see a hook or a BWER on it).
- Echo tops give the height of the highest echo above a threshold (often 18 dBZ); tops near or above the tropopause mark the strongest updrafts.
- Vertically integrated liquid (VIL) adds up reflectivity through the column as an estimate of liquid water in kg/m²; very high VIL for the season suggests large hail.
- Precipitation estimates (one-hour precipitation, storm-total precipitation) convert reflectivity to rain rate using a Z-R relationship (the standard NEXRAD one is ). They are estimates: hail returns far more than its water content, so a hail core makes the radar overestimate rainfall, while rain falling beneath the beam is missed. Dual-pol estimates are better because they also use drop shape.
To see which way rain is moving, the most reliable method is to loop the reflectivity images; velocity shows only the radial part of the wind at each point.
How the beam travels
The WSR-88D beam is about 1° wide, so it spreads with distance (about 1.7 km wide at 100 km, 3.5 km at 200 km) and averages over bigger volumes far from the radar. It also rises with range: Earth curves away beneath a beam that travels almost straight. Under normal conditions, the center of the 0.5° beam is about 1.5 km above the radar at 100 km and about 4 km at 200 km. So:
- far from the radar, low-level features (the hook echo, a tornado's circulation, shallow snow) are overshot, and storms look weaker than they are;
- right above the radar, the highest tilt (19.5°) leaves an unscanned cone of silence, so storms directly overhead are poorly sampled;
- hills, buildings and trees near the radar cause beam blockage, a wedge-shaped shadow of weak or missing echoes behind them.

Refraction. The beam bends because air's refractive index normally decreases with height. In a standard atmosphere the beam bends slightly downward but still less than Earth curves, so it slowly rises above the ground. Super-refraction means the beam bends more than normal, toward Earth's surface; it happens under a temperature inversion or where moisture decreases sharply with height (clear calm nights, cool air under warm air, cool marine layers). When the bending equals or exceeds Earth's curvature, the beam is trapped in a layer and guided along it: this is ducting. A super-refracted beam hits the ground far from the radar, producing false echoes called anomalous propagation (AP). Sub-refraction is the opposite: the beam bends less than normal (with unusually steep lapse rates or moisture increasing with height) and climbs higher, overshooting even more weather.
Non-weather echoes and artifacts.
| Artifact | Cause | How to recognize it |
|---|---|---|
| Ground clutter | Buildings, hills and trees near the radar | Permanent speckled echoes close to the radar; near-zero velocity; filtered out by software |
| Anomalous propagation (AP) | Super-refracted beam hitting the ground | Speckled, often high-dBZ echoes that do not move with the storms, mostly at night or behind outflow; near-zero velocity; very low CC |
| Biological targets | Birds, bats, insects | Expanding rings at dawn as birds leave roosts ("roost rings"); low dBZ; very low CC |
| Bright band | Melting snowflakes: wet, large flakes reflect like big drops | A ring or band of higher reflectivity at the melting level in stratiform rain; it makes rain look heavier than it is |
| Beam blockage | Mountains or structures | Wedge of reduced echo extending outward from the radar |
| Range folding | An echo from a previous pulse returns after the next pulse is sent, so the radar puts it at the wrong (too close) range | Purple "RF" shading on velocity; elongated or misplaced echoes |
| Velocity aliasing | Radial speed exceeds the radar's maximum unambiguous (Nyquist) velocity, so the value wraps around | Sudden jump from strong inbound to strong outbound with no zero line between them; corrected by dealiasing software |
| Three-body scatter spike | Microwaves bounce from large hail to the ground and back to the hail before returning | Weak spike pointing straight away from the radar behind a hail core (see below) |
The pulse rate is a trade-off: a long listening time between pulses gives a long unambiguous range but a low Nyquist velocity, and the reverse. This "Doppler dilemma" is why range folding and aliasing cannot both be removed at once.
Reading velocity
Base velocity shows only the radial component of motion, toward or away from the radar. Standard colors: green (cool) colors are inbound (toward the radar) and red (warm) colors are outbound (away), with brighter shades for faster motion; many displays give values in knots. Motion straight across the beam reads zero, however fast it is. The line where velocities are zero is the zero isodop; it runs along the places where the wind blows perpendicular to the beam.
To find the wind direction near the radar on a widespread velocity display:
- Find the radar at the center.
- The wind blows from the side with the strongest inbound (green) values toward the side with the strongest outbound (red) values.
- The zero isodop through the radar lies perpendicular to the wind.
For example, green to the southwest of the radar and red to the northeast means a southwesterly wind. Because the beam is higher farther from the radar, a bent zero line shows the wind turning with height: an S-shaped zero isodop means the wind veers with height (warm advection), a backward S means it backs (cold advection).
Patterns on smaller scales:
| Pattern on velocity | What it means |
|---|---|
| Inbound and outbound side by side across the beam (couplet, perpendicular to the radials) | Rotation. In the Northern Hemisphere, cyclonic rotation has inbound on the left and outbound on the right as seen from the radar |
| Inbound and outbound in line along the beam, closer one inbound, farther one outbound | Divergence: a downburst near the ground, or storm-top outflow aloft |
| Outbound nearer the radar, inbound farther away, along the beam | Convergence: inflow into an updraft, a gust front |
| A broad band of very strong inbound or outbound winds near the ground | Rear-inflow jet or a derecho; see Wind signatures on radar |
A mesocyclone is a rotation 2 to 10 km across, seen as a broad couplet over several range gates. A tornadic vortex signature (TVS) is a much smaller, very strong couplet with the maximum inbound and outbound values in adjacent gates (gate-to-gate shear). Neither proves a tornado is on the ground; the low-level couplet plus a debris signature on correlation coefficient comes close.
- Storm-relative velocity (SRM) subtracts the motion of the storm itself, so rotation inside a fast-moving storm stands out. Always judge rotation on SRM; base velocity is better for judging the actual wind speed hitting the ground.
- Wind profiles (the VAD wind profile, VWP) use the velocity data around the radar to estimate wind speed and direction at each height, a radar-made hodograph that updates every few minutes.
Dual-polarization products
Since the 2011 to 2013 upgrade, every WSR-88D sends pulses with both horizontal and vertical orientation. Comparing the two returns tells the size, shape and variety of the targets, not just how much power they return. Large raindrops flatten into hamburger-bun shapes as they fall (wider than tall); hail tumbles and looks round on average; debris is irregular. Benefits: better rainfall estimates, telling heavy rain from hail, locating the rain/snow line, and confirming tornado debris.
| Product | What it measures | Rain | Hail | Snow | Debris and birds/insects |
|---|---|---|---|---|---|
| Differential reflectivity (ZDR), dB | Horizontal vs vertical return: positive means wider than tall | Positive, about +0.5 to +4 dB; higher for big drops | Near 0 (−0.5 to +1) with very high Z, because tumbling hail looks round | Near 0 to slightly positive | Near 0 in debris; very high and noisy for insects |
| Correlation coefficient (CC, ρhv), 0 to 1 | How alike the targets in a volume are in size, shape and type | Above about 0.97 | About 0.80 to 0.95 (lower for giant hail) | Above about 0.97 when dry; lower in the melting layer | Below about 0.8, often below 0.7: a tornado debris signature |
| Specific differential phase (KDP), °/km | Phase delay of the horizontal pulse as it passes through liquid water | High in heavy rain (often 1 to 5 °/km); best rain-rate estimator | Near 0 for dry hail (hail does not slow the horizontal wave much) | Near 0 | Not computed where CC is low |
| Hydrometeor classification | An algorithm combining all of the above | Labels rain, heavy rain | Labels hail, big drops | Labels dry or wet snow, graupel, ice crystals | Labels biological, ground clutter |
Pattern to memorize: high reflectivity + ZDR near 0 + CC lowered (0.8 to 0.95) = hail; high reflectivity + high ZDR + CC near 1 + high KDP = very heavy rain; CC below about 0.8 under a velocity couplet = lofted debris. In winter, a ring of lowered CC and raised ZDR marks the melting layer, which shows where snow changes to rain.
Radar signatures of severe storms
Most signature questions ask what feature a pattern indicates. Tornado-specific signatures (hook echo, debris ball, TVS, tornado debris signature) are explained with examples in Tornadoes on radar; bow echoes, rear-inflow notches, bookend vortices and gust-front fine lines in Wind signatures on radar. The table collects them all.
| Signature | Product | What it looks like | What it means |
|---|---|---|---|
| Hook echo | Reflectivity | Hook-shaped appendage on the right-rear (usually southwest) flank of a supercell | Rain wrapping around a mesocyclone; tornado possible near the tip |
| Inflow notch | Reflectivity | A notch of weak echo on the storm's inflow side, near the hook | Strong inflow of warm moist air into the updraft |
| Weak echo region (WER) and bounded weak echo region (BWER) | Reflectivity cross section or several tilts | Low reflectivity under an overhang of high reflectivity; a BWER is enclosed by high echo on the sides and top | An updraft so strong that precipitation cannot form or fall inside it; hail grows around its edge |
| Three-body scatter spike (hail spike) | Reflectivity (mid-level tilts) | Weak, narrow spike extending radially away from the radar behind a core of 60+ dBZ | Large hail |
| V-notch | Reflectivity | A V-shaped gap on the downwind edge of a storm | Strong upper winds diverting around an intense updraft (like water around a rock); a sign of a very strong storm |
| Debris ball | Reflectivity | Small round high-dBZ spot at the hook tip | Lofted tornado debris |
| Mesocyclone | Velocity | Broad couplet of inbound and outbound | Rotating updraft of a supercell |
| TVS | Velocity | Tight couplet, gate-to-gate | Intense, small-scale rotation; tornado possible or occurring |
| Tornado debris signature (TDS) | CC (with ZDR near 0) | Small area of very low CC at the couplet | Tornado on the ground causing damage |
| Bow echo, rear-inflow notch, bookend vortex | Reflectivity and velocity | Bowed line with a notch behind the apex | Damaging straight-line winds; brief tornadoes at the ends |
| Fine line | Reflectivity | Thin line of weak echo ahead of storms | Gust front, outflow boundary or dryline (insects and dust collect along it) |
| Hail core | Reflectivity, ZDR, CC | 60+ dBZ, ZDR near 0, CC lowered | Hail; the core aloft is seen best on composite reflectivity |


A radar operator decides whether a storm is severe from a combination: very high dBZ and VIL, echo tops, strong radial velocities near the ground, and signatures such as a hook, BWER, hail spike, bow echo or couplet. Satellite and model data give the environment, but the radar gives the storm itself.
Satellite imagery
Weather satellites carry passive radiometers that measure radiation in selected wavelength bands (channels). The two kinds of orbit are a trade-off between a constant view and a close view.
| Geostationary (GEO) | Polar-orbiting (LEO) | |
|---|---|---|
| Height | About 35,786 km (22,236 mi) above the equator | About 800 to 850 km |
| Orbit | Over the equator, period 24 h, moving with Earth's rotation, so it hovers over one spot | Passes nearly over both poles, about 14 orbits a day; usually sun-synchronous, crossing each latitude at the same local time |
| U.S. examples | GOES (Geostationary Operational Environmental Satellite): GOES-East near 75° W and GOES-West near 137° W | JPSS satellites (NOAA-20, NOAA-21, and the earlier Suomi NPP); NASA's Terra and Aqua (MODIS) |
| Coverage | The same hemisphere all the time; full disk every 10 minutes, the continental U.S. every 5 minutes, and 1-minute mesoscale sectors over storms | The whole globe, each spot about twice a day |
| Resolution | Coarser (0.5 km visible to 2 km infrared at the point under the satellite), worse toward the edge | Finer, because it is about 45 times closer |
| Weaknesses | Poor view poleward of about 60° to 70°, where Earth is seen at a slant | Gaps in time; cannot loop a developing storm |
| Best for | Watching storms develop and move, loops, cloud-top cooling, hurricane tracking | Polar regions, detailed soundings of temperature and moisture for models, sea ice, sea-surface temperature |
History in one line: TIROS-1 (1960) was the first weather satellite, in a low orbit inclined 48° (not polar: the first true polar orbiters came later in the TIROS series); GOES-1 (1975) was the first GOES, carrying the VISSR (Visible and Infrared Spin Scan Radiometer) imager. The current GOES-R series (GOES-16 to GOES-19; GOES-19 took over as GOES-East in 2025, GOES-18 is GOES-West) carries the Advanced Baseline Imager (ABI) with 16 channels (2 visible, 4 near-infrared, 10 infrared), the Geostationary Lightning Mapper (GLM), which maps total lightning (in-cloud and cloud-to-ground) day and night from optical flashes (details in the lightning section), and space-weather instruments. Rapidly increasing flash rates on GLM often precede severe weather. MODIS is not a GOES instrument; it flies on the polar-orbiting Terra and Aqua.
The three main channels. Every satellite image answers a different question depending on the wavelength.
- Visible (about 0.6 µm, ABI band 2 at 0.64 µm) shows reflected sunlight, like a black-and-white photograph. It works only in daylight. Brightness depends on albedo: thick clouds (cumulonimbus, deep stratiform decks) and fresh snow are bright, thin cirrus is semi-transparent, and oceans and forests are dark. Visible shows texture: the bubbly, cauliflower tops of growing cumulus, overshooting tops, gravity waves, cloud streets, outflow boundaries traced by arc clouds, and the clear eye of a hurricane. In low sun angles, tall towers cast shadows, which is why cloud shadowing is best seen on visible imagery. It cannot tell a high cloud from a low one of the same brightness, and fog and snow both look white.
- Infrared (IR) (longwave window, about 10 to 12 µm, ABI band 13 at 10.3 µm) measures emitted thermal radiation, converted to a brightness temperature. Colder objects emit less, and in the troposphere temperature falls with height, so colder tops are higher tops; by convention cold is shown white and warm surfaces dark. IR works day and night, is used to estimate cloud-top height, and shows sea-surface temperature patterns (the Gulf Stream, upwelling) in clear areas. Weakness: low clouds and fog have nearly the same temperature as the ground, so they are hard to see, especially at night.
- Water vapor (WV) (about 6 to 7 µm, ABI bands 8 to 10 at 6.2, 6.9 and 7.3 µm) uses wavelengths that water vapor itself absorbs and re-emits, so the satellite sees the top of the moist layer in the middle and upper troposphere even where there are no clouds. Moist upper air appears white or bright (cold, high emitting level); dry air is dark (the satellite sees down to a warmer, lower level). WV reveals jet streams, troughs and ridges, upper lows, dry slots, and plumes of moisture such as atmospheric rivers. It does not see the surface or the boundary layer.
Enhanced IR applies a color table to the coldest brightness temperatures only, so the tallest storms stand out in bright colors (reds and blacks colder than about −60 °C to −70 °C). Other channels: shortwave IR (about 3.9 µm) shows fog and low cloud at night and fire hot spots; near-IR snow/ice bands (about 1.6 µm) separate snow on the ground (dark, because ice absorbs there) from cloud. Microwave instruments on polar orbiters can see through cloud to rain bands and hurricane eyewalls.
| Channel | Wavelength | Senses | Works at night? | Bright means | Best for |
|---|---|---|---|---|---|
| Visible | about 0.6 µm | Reflected sunlight | No | High albedo: thick cloud, snow | Texture, shadows, overshooting tops, boundaries, cumulus development |
| Shortwave IR | about 3.9 µm | Emitted plus reflected | Yes | Depends on enhancement | Night fog and low cloud, fires |
| Water vapor | about 6 to 7 µm | Emission from mid/upper-level moisture | Yes | Moist upper air | Jets, troughs, dry slots, moisture plumes |
| Longwave IR | about 10 to 12 µm | Emitted thermal radiation | Yes | Cold (high) tops | Cloud-top height, storm intensity, night tracking |

What severe-weather features look like.
| Feature | Best channel | Appearance |
|---|---|---|
| Developing thunderstorm | Visible loop | Cumulus towers growing, bubbly texture, then a smooth anvil spreading downwind |
| Overshooting top | Visible (low sun) and IR | A dome rising above the flat anvil, casting a shadow; a small spot colder than the anvil: a very strong updraft piercing the tropopause |
| Enhanced-V / cold-U | Enhanced IR | A V- or U-shaped band of cold tops opening downwind of an overshooting top, with a warm spot in the middle; strongly linked to severe hail, wind and tornadoes |
| Mesoscale convective complex (MCC) | Enhanced IR | A huge, roughly circular cold shield (about −32 °C cloud tops over 100,000 km², a colder −52 °C core over 50,000 km², lasting 6 h or more), typically forming at night over the Plains; MCCs are identified by satellite, not radar |
| Squall line | Visible, IR | A long line of cold tops with a sharp leading edge |
| Mid-latitude cyclone | IR, WV | A comma cloud: the head over the low, the tail along the cold front; a dry slot (dark on WV, cloud-free on visible) wraps into the center behind the cold front |
| Hurricane | Visible, IR | Spiral bands around a central dense overcast (CDO); a clear, warm eye in a mature storm (see the hurricane section) |
| Cloud streets | Visible | Parallel rows of cumulus along the wind, for example cold air over warmer lakes before lake-effect snow |
| Arc cloud | Visible | A curved line of cumulus marking an outflow boundary; new storms often fire where it meets other boundaries |

Research satellites and instruments that appear on tests. Weather imagers are passive (they measure radiation the scene reflects or emits); active sensors send their own pulse and time the echo, like radar and lidar, and radar (including synthetic aperture radar) sees through cloud cover that blocks visible and IR sensors.
| Satellite or instrument | Type | What it measures |
|---|---|---|
| MODIS (on NASA's Terra, launched 1999, morning pass, and Aqua, 2002, afternoon pass) | Passive multispectral imager: 36 bands from visible to thermal infrared (about 0.4–14.4 µm), 250 m–1 km pixels, whole Earth every 1–2 days | Clouds and cloud-top properties, aerosols and smoke, fires, snow and sea ice, sea-surface temperature, vegetation |
| CERES (on Terra, Aqua, Suomi NPP, NOAA-20) | Passive broadband radiometer | Earth's radiation budget (reflected sunlight and emitted longwave) and the effect of clouds on it |
| CloudSat | Active 94 GHz cloud-profiling radar | Vertical cross-sections of clouds (a curtain under the orbit track), including inside hurricanes |
| CALIPSO | Active lidar | Vertical profiles of thin clouds and aerosols (dust, smoke) |
| Aura | Passive atmospheric-chemistry instruments | Ozone, air quality and trace gases |
| Aqua, Aura, CloudSat, CALIPSO together (CloudSat and CALIPSO moved out of the formation in 2018) | the A-Train: satellites flying in close formation so the same scene is measured minutes apart | combined cloud, aerosol and radiation studies |
Forecast data: maps, codes, hodographs and models
Surface maps, station models and METAR
Isolines
Weather maps connect points with equal values of a variable using isolines (isopleths). Tests ask for the names and definitions.
| Isoline | Connects equal | Notes |
|---|---|---|
| Isobar | Pressure (sea-level pressure on surface maps) | Usually every 4 hPa (1000, 1004, 1008 …); closely spaced isobars = steep pressure gradient = strong wind |
| Isotherm | Temperature | Often dashed, every 5 °F or 2 to 5 °C; packed isotherms mark fronts and baroclinic zones |
| Isodrosotherm | Dew point | Shows moisture tongues and drylines (packed dew-point lines) |
| Isohyet | Precipitation amount | Rainfall-total and flood maps |
| Isotach | Wind speed | Upper-air charts (300 or 250 hPa) to locate jet streaks |
| Isallobar | Pressure change over a set time (for example, 3 hours) | Falls ahead of an approaching low; the largest falls point to where the low is heading |
| Height contour (isohypse) | Height of a constant-pressure surface | Upper-air charts (850, 500, 300 hPa), in meters or decameters; they play the same role aloft that isobars play at the surface |
| Isoneph | Cloud cover | Rarely used |
Reading isobars. H marks a high-pressure center and L a low. In the Northern Hemisphere, surface winds blow counterclockwise and inward around a low and clockwise and outward around a high (the reverse in the Southern Hemisphere). Aloft, winds blow almost parallel to the contours (geostrophic balance); at the surface, friction slows the wind and turns it across the isobars toward low pressure, by roughly 10° to 20° over water and about 30° (20° to 45°) over rough land. The closer the isobars, the stronger the pressure-gradient force and the wind; widely spaced isobars mean light winds. Lows bring rising air, clouds and precipitation; highs bring sinking air and generally fair weather. Elongated areas of low pressure are troughs (dashed lines on NWS maps, no closed isobar needed) and elongated highs are ridges. The forces behind these patterns are covered in the section on pressure and wind.
Front symbols
Fronts are drawn as colored lines with symbols placed on the side toward which the front is moving. The weather along each front and its structure are explained in the section on air masses and fronts; here are only the map symbols.
| Symbol | Front | Meaning |
|---|---|---|
| Blue line with triangles | Cold front | Cold air advancing; triangles point toward the warm air it is moving into (typically toward the southeast) |
| Red line with half circles | Warm front | Warm air advancing; half circles point toward the cold air ahead |
| Alternating blue triangles and red half circles on opposite sides | Stationary front | Neither air mass is advancing; the triangles face the warm side, the half circles the cold side |
| Purple line with triangles and half circles on the same side | Occluded front | The cold front has caught up with the warm front |
| Dashed orange (or brown) line | Surface trough | Elongated low pressure, a wind shift without a full air-mass change |
| Red dash-dot-dot line | Squall line | A line of thunderstorms (pre-frontal) |
| Orange (or brown) line with open half circles (scallops) | Dryline | Boundary between moist and dry air, usually running north-south across the southern Plains |
| Orange line (on tropical maps) | Tropical wave | Trough in the easterlies |

On a severe-weather map, look for the boundaries where storms start: fronts, drylines (a sharp dew-point drop over a short distance), outflow boundaries left by earlier storms, and the triple point where a dryline meets a front. Packed isotherms with a wind shift point to a front even where none is drawn; on an 850 hPa chart, wind blowing from warm isotherms toward a point means warm advection there.
The station model
A station model packs one observation into one symbol around a small circle at the station's location. In the U.S. version, temperatures and dew points are in °F, wind in knots, pressure in tenths of hPa (coded).
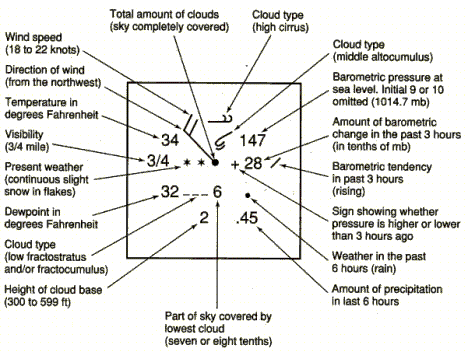
| Position | Element | How it is coded |
|---|---|---|
| Upper left | Air temperature | °F in the U.S. (°C on international maps) |
| Lower left | Dew point | Same unit; the gap from the temperature is the dew-point depression |
| Far left | Visibility | Statute miles, as a number or fraction |
| Left, between temperature and dew point | Present weather | Symbol (dots = rain, stars = snow, commas = drizzle, ▽ = showers, ≡ = fog, ∞ = haze; see the table below) |
| Center circle | Total sky cover | Fraction filled in oktas (eighths) |
| Shaft from the circle | Wind direction | Points toward the direction the wind blows from |
| Barbs and flags on the shaft | Wind speed | Half barb 5 kt, full barb 10 kt, flag (pennant) 50 kt |
| Upper right | Sea-level pressure | Last three digits in tenths of hPa, leading 9 or 10 dropped |
| Right | Pressure tendency | 3-hour change in tenths of hPa with + or −, then a trace symbol for how it changed |
| Lower right | Past weather and precipitation | Symbol for weather in the past 6 hours; precipitation in inches |
| Above the circle | Middle and high cloud types | Symbols (high on top) |
| Below the circle | Low cloud type, amount and base height | Symbol and codes |
Sea-level pressure. The plotted number is the last three digits of the pressure in tenths of hPa. To decode, put a decimal before the last digit and add 9 or 10 in front, choosing whichever gives a value closest to 1000 hPa:
- if the code is below 500, put a 10 in front: 147 → 1014.7 hPa; 038 → 1003.8 hPa;
- if the code is 500 or more, put a 9 in front: 876 → 987.6 hPa; 995 → 999.5 hPa.
To encode, drop the leading 9 or 10 and the decimal point: 1008.4 hPa → 084; 992.1 hPa → 921. The rule works because real sea-level pressures fall between about 950 and 1050 hPa.
Pressure tendency. The number gives the change in the last 3 hours in tenths of hPa: +28 means a rise of 2.8 hPa and −15 a fall of 1.5 hPa. The trace symbol after it shows how the change happened (rising steadily /, rising then falling ∧, falling then rising ∨, steady —, and so on). A steady fall warns of an approaching low or front.
Wind barbs. Add up the feathers: each pennant 50 kt, each full barb 10 kt, each half barb 5 kt, rounded to the nearest 5 kt. The barbs sit on the end of the shaft away from the circle. Calm is shown by a second circle drawn around the station circle. 1 kt = 1.15 mph = 0.514 m/s.

Sky cover in oktas. The station circle is filled according to how many eighths of the sky are covered: empty = clear (0), a vertical line = 1/8, quarter filled = 2/8, half = 4/8, three quarters = 6/8, solid = 8/8 overcast, and an X = sky obscured (fog, heavy snow, smoke). A missing observation is shown by M.

| Present-weather symbol | Meaning |
|---|---|
| Dots (•) | Rain; two side by side = continuous light rain, more dots stacked = heavier |
| Commas (,) | Drizzle |
| Asterisks (*) | Snow; two side by side = continuous light snow |
| A symbol above a downward-pointing triangle (▽) | A shower of that type: dot over ▽ = rain shower, star over ▽ = snow shower |
| Solid triangle (▲) | Hail (usually drawn over ▽ as a hail shower) |
| Open triangle (△) | Ice pellets (sleet) |
| Dot or comma with a curved "~" hook | Freezing rain or freezing drizzle |
| Three horizontal lines (≡) | Fog |
| Two horizontal lines (=) | Mist |
| ∞ | Haze |
| A capital-R-like symbol with a lightning arrow | Thunderstorm (a dot or star above it adds rain or snow) |
| )( | Funnel cloud or tornado |
| S-shaped symbol with an arrow through it | Dust storm or sandstorm |
| Arrow over a star (→ with *) | Blowing snow |
METAR
METAR (from the French for routine aviation weather report, usually expanded as METeorological Aerodrome Report) is the coded hourly surface observation made at airports, mostly by ASOS. Routine reports go out once an hour, typically just before the hour (for example at 53 minutes past); a SPECI is a special report issued between hours when conditions change significantly (a thunderstorm begins, visibility or ceiling crosses a threshold, a tornado is seen). Groups always come in the same order: type, station, day and time, wind, visibility, runway visual range, present weather, sky condition, temperature/dew point, altimeter, then remarks after RMK. Missing groups are skipped.
ReferenceMETAR decoder· 52 rows
Every group in the order it appears. Heights are in hundreds of feet above ground level (AGL); speeds in knots; temperatures in °C.
No rows match.
| Group | Example | Meaning |
|---|---|---|
| Report type | METAR / SPECI | Routine hourly report / special report |
| Station (ICAO identifier) | KOKC | Four letters; contiguous U.S. stations start with K (Alaska PA, Hawaii PH; Canada C; Europe E or L) |
| Day and time | 122253Z | 12th of the month, 2253 UTC (Z = Zulu = UTC) |
| Report modifier | AUTO / COR | Fully automated with no human / corrected report |
| Wind | 27035G52KT | From 270° (true) at 35 kt, gusting to 52 kt; first three digits direction to the nearest 10°, then speed |
| Variable wind | VRB04KT | Direction variable at 4 kt (light winds) |
| Variable direction | 33007KT 300V360 | Direction varying between 300° and 360° |
| Calm | 00000KT | Calm |
| Other speed unit | 09012MPS | From 090° at 12 meters per second (some countries) |
| Visibility | 10SM, 2SM, 1/2SM, M1/4SM | Statute miles; M = less than; 10SM means 10 or more |
| Visibility in meters | 9999, 1200 | International: 9999 = 10 km or more; 1200 = 1,200 m |
| Runway visual range | R04/P6000FT | Runway 04 visual range more than (P = plus) 6,000 ft |
| Intensity | -RA, RA, +RA | Light, moderate (no sign), heavy; +FC is a tornado or waterspout |
| Vicinity | VCTS, VCSH | Within 5 to 10 miles of the station, not at it |
| Descriptor TS | TSRA | Thunderstorm (with rain) |
| Descriptor SH | SHRA, SHSN | Showers |
| Descriptor FZ | FZRA, FZDZ, FZFG | Freezing (rain, drizzle, fog) |
| Descriptor BL / DR | BLSN, DRSN | Blowing (above 6 ft) / low drifting (below 6 ft) |
| Descriptor MI, BC, PR | MIFG, BCFG | Shallow, patches, partial |
| Precipitation | RA, DZ, SN, SG | Rain, drizzle, snow, snow grains |
| Precipitation | GR, GS | Hail of any size (size in remarks, e.g. GR 1 3/4); snow pellets (graupel) |
| Precipitation | PL, IC, UP | Ice pellets (sleet), ice crystals, unknown precipitation (automated) |
| Obscuration | BR, FG | Mist (visibility 5/8 to 6 mi), fog (below 5/8 mi) |
| Obscuration | HZ, FU, DU, SA, VA, PY | Haze, smoke, dust, sand, volcanic ash, spray |
| Other | SQ | Squall: sudden wind increase of 16 kt or more to 22 kt or more, lasting a minute or more |
| Other | FC, +FC | Funnel cloud; tornado or waterspout |
| Other | DS, SS, PO | Dust storm, sandstorm, dust/sand whirls |
| Sky clear | CLR, SKC | Clear below 12,000 ft (automated) / clear (human) |
| Few | FEW025 | 1/8 to 2/8 of sky covered, base 2,500 ft AGL |
| Scattered | SCT035 | 3/8 to 4/8 covered, base 3,500 ft |
| Broken | BKN015 | 5/8 to 7/8 covered, base 1,500 ft |
| Overcast | OVC040 | 8/8 covered, base 4,000 ft |
| Cloud type | BKN015CB, SCT030TCU | Cumulonimbus; towering cumulus (only these two are coded) |
| Vertical visibility | VV002 | Sky obscured (fog, heavy snow); can see 200 ft up into it |
| Ceiling | BKN or OVC or VV | The lowest broken or overcast layer (or the vertical visibility) is the ceiling |
| CAVOK | CAVOK | International: ceiling and visibility OK (10 km+, no cloud below 5,000 ft, no significant weather) |
| Temperature/dew point | 21/18, 17/M06 | °C; M = minus: 17 °C and −6 °C |
| Altimeter | A2968 | 29.68 inHg (U.S.) |
| QNH | Q1011 | 1011 hPa (international altimeter setting) |
| No change expected | NOSIG | International trend: no significant change |
| Remarks begin | RMK | Everything after is remarks |
| Station type | AO1 / AO2 | Automated station without / with a precipitation discriminator (can tell rain from snow) |
| Peak wind | PK WND 27058/2241 | Peak wind from 270° at 58 kt at 2241 UTC |
| Wind shift | WSHFT 30 FROPA | Wind shift at 30 minutes past the hour, due to frontal passage |
| Pressure trend | PRESRR / PRESFR | Pressure rising rapidly / falling rapidly |
| Sea-level pressure | SLP134 | 1013.4 hPa (same 9-or-10 rule as the station model) |
| Begin/end times | TSB12E45, RAB36 | Thunderstorm began at :12, ended at :45; rain began at :36 |
| Lightning | LTG DSNT ALQDS, CB DSNT S | Distant lightning in all quadrants; cumulonimbus distant to the south |
| Precipitation amount | P0000, P0012 | Hourly precipitation, hundredths of an inch: trace (0000), 0.12 in |
| Temperature group | T02220183 | Precise values in tenths of °C: 0 = positive, 1 = negative: 22.2 °C, 18.3 °C |
| 3-hour pressure tendency | 52012 | 5 = tendency group, 2 = increasing steadily or unsteadily, 012 = 1.2 hPa (higher than 3 hours ago) |
| Maintenance | $ | Station needs maintenance |
Ceiling. The ceiling is the height of the lowest layer reported as broken (BKN) or overcast (OVC), or the vertical visibility into an obscuration. FEW and SCT layers never form a ceiling. Ceiling and visibility define flight categories, which is why pilots care.
Decoding sea-level pressure in remarks. SLP gives the last three digits in tenths of hPa: SLP097 → 1009.7 hPa, SLP162 → 1016.2 hPa, SLP982 → 998.2 hPa.
Temperature group. T then four digits for temperature and four for dew point: the first digit is 0 for positive and 1 for negative, the rest are tenths of °C. T01440122 = 14.4 °C and 12.2 °C; T10561067 = −5.6 °C and −6.7 °C.
Meteograms and forecast products
A meteogram is a time series of several weather variables at one location, either observed (from hourly METARs) or forecast (from a model). Typical panels: temperature and dew point, pressure, wind barbs along a time axis, cloud cover and precipitation. Reading one is a matter of spotting the changes that mark events: a cold front shows a sharp temperature and dew-point drop, a wind shift from south or southwest to northwest, a pressure minimum followed by a rise, and a burst of precipitation; a warm front shows a slow pressure fall, long steady precipitation, then a rise in temperature and dew point and a wind shift to the south; a thunderstorm passage shows a sudden pressure jump (a "pressure dome" under the cold downdraft), a temperature drop, a gust spike and a short burst of heavy rain. A meteogram is the wrong tool for a vertical profile, which needs a sounding (Stüve or Skew-T).

Data-file abbreviations. Meteogram plotters and observation downloads (GEMPAK, the Iowa Environmental Mesonet's ASOS archive) label columns with short codes. Learn the pattern: a letter in the code often gives the unit (TMPF = °F, TMPC = °C, P01I = inches, SKNT = knots).
| Code | Meaning | Unit |
|---|---|---|
| TMPF / TMPC | Air temperature | °F / °C |
| DWPF / DWPC | Dew-point temperature | °F / °C |
| RELH | Relative humidity | % |
| DRCT | Wind direction (from which it blows) | degrees from true north |
| SKNT | Wind speed | knots |
| SMPH / SPED | Wind speed | mph / m/s |
| GUST | Peak wind gust | knots |
| PMSL (MSLP) | Mean sea-level pressure | hPa (mb) |
| ALTI | Altimeter setting | inHg |
| VSBY | Visibility | statute miles |
| P01I (P03I, P06I) | Precipitation in the past 1 (3, 6) hours | inches |
| SKYC / CEIL | Sky cover / ceiling height | code (CLR, FEW, SCT, BKN, OVC) / hundreds of feet |
| WTHR (WXCODES) | Present weather | METAR codes (RA, SN, TS…) |
Other forecast displays you may be handed: model forecast panels (maps of pressure, precipitation or instability at a future time), probability maps, and SPC and NHC products (explained in the weather safety section).
Hodographs
A hodograph plots the wind at several heights as vectors from a common origin and connects their tips. It is a picture of vertical wind shear: the length of the line is how much the wind changes, and its curvature shows how the direction turns with height. It is the quickest single tool for telling which storm type (single cell, multicell or supercell) an environment favors. Hodographs are used to find shear, storm motion and helicity, and to infer temperature advection.
How to plot one. Draw concentric rings for wind speed (every 10 or 20 kt) around an origin, with compass directions on the axes. For each level (surface, 1 km, 2 km … 6 km or more), draw an arrow from the origin pointing in the direction the wind is blowing toward, with length equal to its speed, and mark the arrow's tip with the height. Connect the tips in order of height. The arrows themselves are usually erased; only the curve remains. The vector from one point on the curve to the next is the shear vector for that layer.

Speed and directional shear. Speed shear is a change of wind speed with height (the curve runs straight outward from the origin); directional shear is a change of direction (the curve swings around the origin). Most severe environments have both. Veering means the wind turns clockwise with height (south at the surface, southwest at 1 km, west at 3 km); backing means it turns counterclockwise (south to southeast). In the Northern Hemisphere, winds that veer with height indicate warm-air advection in that layer, and winds that back with height indicate cold-air advection (a consequence of the thermal wind). Veering with height ahead of a warm front is a classic tornado-day profile.
What the shape means.
- A short, tangled hodograph means weak shear: single-cell (pulse) storms whose downdraft falls into the updraft and kills it within an hour.
- Moderate shear with a mostly straight hodograph: multicell clusters and lines, with new cells forming on the side of the storm facing the warm, moist inflow.
- A long hodograph means strong shear, which organizes storms and keeps the updraft separate from the downdraft.
- A straight hodograph favors storms that split into left- and right-moving supercells of similar strength.
- A hodograph that curves clockwise (winds veer with height in the lowest few kilometers) favors right-moving supercells, the ones that produce most strong tornadoes in the Northern Hemisphere.
| 0 to 6 km bulk shear | Typical storm mode |
|---|---|
| Below about 20 kt (10 m/s) | Single-cell (pulse) storms |
| About 20 to 40 kt | Multicell clusters and lines (squall lines need moderate to strong shear) |
| About 40 kt (20 m/s) or more | Supercells possible |
Storm-relative helicity (SRH) measures how much the low-level wind turns and how much of that turning spiral air a moving storm can ingest. Horizontal spin produced by shear (like a rolling pencil between the surface and the faster wind above) is tilted into the vertical by an updraft; if the inflow's spin lines up with the inflow direction (streamwise vorticity), the updraft itself rotates, making a mesocyclone. On a hodograph, SRH is proportional to the area swept out between the storm-motion point and the hodograph curve over a layer (twice that area, by definition); a big clockwise loop in the lowest kilometers gives large SRH. Rough guides: 0 to 3 km SRH above about 150 m²/s² supports supercells and above about 300 m²/s² strong ones; 0 to 1 km SRH above about 100 to 150 m²/s² favors tornadoes. Combined indices such as the Energy-Helicity Index (EHI) and the Significant Tornado Parameter multiply instability by helicity or shear, because tornadoes need both.
Computer models
Forecasting methods, from simplest to NWP. Tests ask which method fits which situation.
| Method | Idea | Works best |
|---|---|---|
| Persistence | Tomorrow will be like today | Very short range, or in a stagnant pattern (a stalled high, the dry season, a desert) |
| Trend (steady-state) | Systems keep their speed and direction; extrapolate a front's or storm's past motion | Minutes to a few hours: nowcasting storms on radar, timing a front |
| Climatology | Forecast the long-term average for that date and place | Long ranges where other methods lose skill; places with very steady climates |
| Analog | Find a past weather pattern that resembles today's and forecast what happened next | Medium range and pattern recognition, though no two patterns ever match exactly |
| Numerical (NWP) | Solve the physics equations forward in time on a computer | The basis of nearly all modern forecasts from hours to about two weeks |
Forecasters blend them: NWP guidance corrected by statistics (MOS, below), checked against persistence, trends and climatology. A forecast is judged by whether it beats persistence or climatology (its skill).
Numerical weather prediction (NWP) solves the equations of motion, thermodynamics and moisture forward in time on a three-dimensional grid. The steps are always the same:
- Observations from radiosondes, satellites, aircraft, surface stations, buoys and radar are collected.
- Data assimilation blends them with the previous short-range forecast (the "first guess") into a best estimate of the current state, the analysis or initial conditions. Most of the globe has no direct observations, so satellite data and the first guess fill the gaps.
- The model integrates the equations forward in small time steps.
- Processes smaller than a grid box (individual clouds and thunderstorms in coarse models, turbulence, radiation) cannot be resolved and are represented by approximate rules called parameterizations.
- Post-processing turns raw output into maps, meteograms, soundings and statistical guidance.
| Model | Run by | Grid spacing (approx.) | Runs per day | Forecast length | Use |
|---|---|---|---|---|---|
| GFS (Global Forecast System) | NOAA/NCEP (U.S.) | about 13 km | 4 (00, 06, 12, 18 UTC) | 16 days | Global patterns, medium range |
| ECMWF ("European", IFS) | European Center for Medium-Range Weather Forecasts | about 9 km | 4 | 10 to 15 days | Global; generally the highest verification scores |
| NAM (North American Mesoscale) | NCEP | 12 km (3 km nest) | 4 | 84 h (3.5 days) | Regional; NOAA scheduled the Rapid Refresh Forecast System (RRFS) to replace it on November 3, 2026 (after several delays), but it is still common on older tests |
| RAP (Rapid Refresh) | NCEP | 13 km | Hourly | up to about 51 h | Short-range, North America, frequent updates |
| HRRR (High-Resolution Rapid Refresh) | NCEP | 3 km | Hourly | 18 h (48 h every 6 hours) | Convection-allowing: simulates individual thunderstorms and lines |
| GEFS and ECMWF ensemble | NCEP, ECMWF | coarser or similar | 4 | 16 days, 15 days | Ensembles of about 31 and 51 members |
| Hurricane models (HAFS) | NCEP | km-scale moving nests | 4 | about 5 days | Tropical cyclone track and intensity |
Global vs regional, coarse vs fine. Global models handle large-scale patterns (troughs, ridges, cyclones) days ahead. Regional models cover a limited area at finer spacing, taking their edges (boundary conditions) from a global model. Convection-allowing models (grid spacing about 4 km or less, such as the HRRR) simulate thunderstorms explicitly rather than parameterizing them, so they show storm mode (discrete supercells vs lines) a few hours ahead.
Deterministic vs ensemble. A deterministic forecast is a single run from one best analysis. An ensemble runs the same model (or several models) many times with slightly different initial conditions and/or physics. Where the members agree, confidence is high; where they spread, the forecast is uncertain, and the spread itself is information (it gives probabilities). The ensemble mean is usually more accurate than any single member after the first few days. A spaghetti plot draws one contour (for example, the 5,640 m line at 500 hPa) or one hurricane track from each member on the same map, so agreement looks like a tight bundle and uncertainty like spaghetti spilled across the map.

Model output statistics (MOS) corrects raw model output using statistical relationships (regression) between past model forecasts and what was actually observed at each station, removing systematic biases (for example, a model that is always 2 °F too warm in a valley) and producing station forecasts of temperature, wind and probability of precipitation.
Hurricane forecasts. The National Hurricane Center's official track is close to a consensus (average) of the best models, because a consensus beats almost any single model on average. The cone of uncertainty is drawn from circles around each forecast position sized so that about two-thirds of the official track errors over the previous five years would fall inside; the center is expected to stay in the cone only about 60 to 70% of the time, and the cone says nothing about the storm's size, so impacts often extend far outside it. Intensity is harder to forecast than track, because rapid intensification depends on small-scale processes in the inner core and on ocean heat content that models resolve poorly.
Why models disagree and why skill fades.
- Imperfect initial conditions: observations are sparse (oceans, upper air), have errors, and are blended imperfectly.
- Chaos: the equations are nonlinear and very sensitive to initial conditions, so small errors grow until, after roughly two weeks, a day-to-day forecast has little skill. Better data and computers push the limit out but cannot remove it.
- Resolution and parameterization: different grids and physics produce different storms.
- Numerical approximations and boundary conditions add error.
A short historical record is not the reason skill drops with lead time; that is a statistics problem, not an NWP one.
What sets up severe weather
Forecasters look for four ingredients: moisture, instability, lift and, for organized storms, wind shear. The rules list the large-scale features that supply them.
The sections below take them in turn: air masses supply moisture and contrast; fronts and drylines supply lift; mid-latitude cyclones and jet streams organize both; ENSO and the oceans set the fuel; atmospheric rivers carry moisture to the West; terrain adds lift and downslope wind. Shear, the fourth ingredient, is measured with Hodographs.
Air masses
An air mass is a huge body of air, often more than 1,500 km across, with fairly uniform temperature and humidity at any given height. It forms when air stagnates for days to weeks over a large, uniform source region (a snow-covered plain, a desert, a warm sea) and takes on that surface's properties. Good source regions are under high pressure with light winds, so the air stays put, and are flat and uniform. The middle latitudes, with their constant traffic of fronts, are poor source regions; that is why air masses move into the United States rather than forming there.
Naming. The first, lowercase letter gives moisture: c = continental (formed over land, dry), m = maritime (formed over ocean, moist). The second, uppercase letter gives temperature by source latitude: A = arctic (very cold), P = polar (cold), T = tropical (warm to hot), E = equatorial (hot and very humid; rarely used for North America). An optional third letter compares the air mass with the surface it is moving over: k = colder than the surface (it is heated from below, so it becomes unstable, with gusty winds, cumulus and showers), w = warmer than the surface (cooled from below, stable, with stratus, fog and drizzle).
| Air mass | Source region (North America) | Temperature and moisture | Stability at the source | Season | Typical U.S. weather |
|---|---|---|---|---|---|
| cA continental arctic | Arctic Ocean ice and snow fields, northern Canada, Greenland | bitterly cold, very dry | very stable (strong surface inversion) | winter | arctic outbreaks: record cold, wind chill, clear skies, light fluffy snow; lake-effect snow after crossing the Great Lakes |
| cP continental polar | interior Canada and Alaska | cold (very cold in winter, cool in summer), dry | stable | all year (strongest in winter) | cold, clear, dry air behind cold fronts; pleasant cool dry spells in summer |
| mP maritime polar | North Pacific (Gulf of Alaska) and North Atlantic (off New England and Newfoundland) | cool, moist | conditionally unstable, especially Pacific mP heated from below in winter | all year | Pacific: rain on the coast and heavy snow in the Cascades and Sierra; Atlantic: cold, cloudy, damp northeasters in New England |
| mT maritime tropical | Gulf of Mexico, Caribbean, subtropical Atlantic and Pacific | warm to hot, humid | unstable (especially in summer over land) | all year (dominant in summer) | humid heat, high dew points, fuel for thunderstorms, tornadoes and heavy rain east of the Rockies; fog where it moves over cold ground |
| cT continental tropical | Desert Southwest and northern Mexico (the Mexican plateau) | hot, very dry | unstable near the ground but capped aloft | summer (rarely in winter) | heat waves, drought, low humidity, fire weather; its elevated warm layer becomes the Plains cap |
| mE maritime equatorial | equatorial oceans | hot, saturated | unstable | all year | reaches the U.S. mainly inside tropical cyclones |

Density ranking. Cold air is denser than warm air, and dry air is (slightly) denser than moist air at the same temperature, because water-vapor molecules (18 g/mol) are lighter than the nitrogen and oxygen they replace (about 29 g/mol). So the densest air mass is cold and dry (cA or cP), and the least dense is hot and humid (mT). Denser air always stays at the bottom: at a front, the colder air wedges under and the warmer air is lifted.
Modification. Air masses change as they leave their source. Contact with the ground underneath is the main cause, along with added moisture, lifting and sinking.
- cP or cA over a warm lake in late fall and winter: the lake heats and moistens the bottom layer, making it unstable (cPk); this is lake-effect snow (see Severe winter storms).
- cA over a warm ocean becomes mP: Arctic air streaming off the continent over the Gulf Stream or the North Pacific gains heat and moisture.
- cP moving south over the warm U.S. in winter warms from below but stays dry.
- mT over cold land or water is cooled from below (mTw): stable, with advection fog and stratus, as when Gulf air flows over snow cover.
- Pacific mP crossing the western mountains loses its moisture on the windward slopes and descends the lee warmer and drier, so "Pacific air" reaches the Great Plains as mild, dry air.
Moving air masses carry their weather with them, so a change of air mass is the biggest single change in a place's day-to-day weather; muggy summer days in the Southeast are mT days, and crisp, clear fall days in the Midwest are cP days.
Fronts and drylines
A front is the boundary, or transition zone, between two air masses of different density, usually different temperature and often different moisture. It is named for the air that is advancing. Across a front you find a change in temperature, a change in dew point, a wind shift, and a pressure trough (pressure falls as a front approaches and rises after it passes, because fronts lie in troughs of low pressure). Fronts usually extend from the center of a low pressure system, which is why fronts and lows appear together on surface maps: a low is where contrasting air masses are being drawn together.
The map symbols for each front are shown under Front symbols.
| Front | Map symbol | What happens | Usual motion in the U.S. | Slope and speed | Clouds and precipitation |
|---|---|---|---|---|---|
| Cold | blue line, triangles on the side toward which it moves | cold, dense air advances and wedges under warm air, lifting it abruptly | from northwest to southeast (or west to east, north to south) | steep, about 1:50 to 1:100; fastest front, often 20 to 30 mph or more | cumulus and cumulonimbus; a narrow band of heavy showers and thunderstorms at or just ahead of the front, sometimes a squall line; hail, gusty winds; then rapid clearing |
| Warm | red line, semicircles on the side toward which it moves | warm air advances and glides up and over retreating cold air (overrunning) | poleward, usually south or southwest to north or northeast | gentle, about 1:200 to 1:300; slow, often about half the speed of a cold front | clouds lower and thicken over a day or two: cirrus → cirrostratus → altostratus → nimbostratus (stratus and fog near the front); a wide band (hundreds of km) of steady, light to moderate stratiform rain or snow ahead of the front; freezing rain or sleet if the surface air is below freezing; embedded storms only if the overrunning air is unstable |
| Stationary | alternating blue triangles and red semicircles, pointing to opposite sides | neither air mass displaces the other; winds blow roughly parallel to the front, in opposite directions on each side | little or none (it may drift or become a warm or cold front again) | — | cloudy, sometimes days of persistent rain; repeated storms along it can cause flooding; often where new waves (lows) form |
| Occluded | purple line with alternating triangles and semicircles on the same side | the faster cold front catches the warm front and lifts the warm-sector air completely off the ground; three air masses meet | wraps around the north side of a mature low | — | mix of warm-front stratiform precipitation and cold-front showers; the comma-head clouds of a mature storm; snow on the cold side in winter |
| Dryline | brown or orange line with open semicircles (scallops) | a moisture boundary between moist Gulf air (east) and dry desert air (west), with little temperature difference | moves east by afternoon mixing, retreats west at night | — | clear on the dry side; towering cumulus and isolated supercells on the moist side in spring afternoons |

Why cold fronts are more violent than warm fronts. Both lift warm air. A cold front's steep nose and fast speed force the warm air up sharply over a narrow zone, often a few tens of kilometers, so conditionally unstable air is driven past its LFC: tall cumulonimbus, a narrow line of heavy rain, hail and gusty winds that passes in an hour or two. A warm front's gentle slope lifts air slowly over hundreds of kilometers, giving layered (stratiform) clouds and long-lasting, gentle rain. Cold fronts also move faster because the dense cold air pushes forward along the ground, while a warm front advances only as the cold air ahead of it retreats or is eroded by friction and mixing. Cold fronts typically move about twice as fast as warm fronts.

Changes as a front passes (Northern Hemisphere, a typical U.S. case).
| Element | Cold front: before | Cold front: after | Warm front: before | Warm front: after |
|---|---|---|---|---|
| Temperature | warm | drops sharply | cool or cold | rises |
| Dew point | high | drops | steady, then rising in the precipitation | rises |
| Wind | south to southwest | shifts to west or northwest, gusty | east to southeast | shifts to south or southwest |
| Pressure | falling | lowest at the front, then rising sharply | falling steadily | levels off, then may fall slowly |
| Clouds | building cumulus, cumulonimbus (sometimes cirrus well ahead) | clearing, scattered cumulus | cirrus thickening to nimbostratus | clearing, scattered cumulus or haze |
| Precipitation | showers and thunderstorms, short and heavy | ending; snow showers in winter | long, steady light to moderate rain or snow | usually ending; warm-sector showers or storms possible |
Occluded-front passage looks like a cold front (wind shifting from southeast or south to west, pressure lowest at the front then rising) with temperature dropping slightly for a cold-type occlusion and rising slightly for a warm-type. At a stationary front the wind on each side blows parallel to the front from opposite directions, and conditions barely change for days. At a dryline the dew point plunges (often 20 °F or more within a few miles) as the wind veers from southeast to southwest or west, while the temperature may even rise in the afternoon.
Occluded fronts in more detail. An occlusion forms late in a cyclone's life when the cold front, moving faster, overtakes the warm front and the warm, moist air of the warm sector is lifted off the ground. Three air masses meet: the cold air behind the cold front, the cool air ahead of the warm front, and the warm air pushed aloft. In a cold-type occlusion the air behind the cold front is colder than the air ahead of the warm front, so it slides under both; in a warm-type occlusion the air behind is less cold, so it rides up over the colder air ahead. Classic textbooks say most occlusions over the eastern Pacific, western North America and Europe are warm-type (later studies find the type depends more on stability than on temperature alone), because the cold front's air has been modified by the ocean and is less dense than the very cold continental air ahead of the warm front. Either way, occlusion cuts the storm off from its warm, moist air and marks its mature-to-dying stage. The point where the cold, warm and occluded fronts meet is the triple point, a favored spot for tornadoes in the warm sector.

Drylines in more detail. The dryline, also called a dew-point front, is the boundary between moist mT air from the Gulf and hot, dry cT air from the desert Southwest and Mexican plateau. It is most common from April to June over the southern and central High Plains (west Texas, Oklahoma, Kansas, eastern New Mexico and Colorado), typically running north–south. Its power comes from a density difference: at the same temperature, moist air is less dense than dry air, so the dry air behaves like a cold front and lifts the moist air ahead of it, while daytime mixing on the dry side (hot ground, deep mixing) pushes the boundary east in the afternoon. It retreats west after sunset. Storms fire along bulges in the dryline and where it meets a front (the dryline–front triple point), and because the moist air ahead is capped and the storms are isolated, they often become long-lived supercells.
Other boundaries. A backdoor cold front moves in from the northeast or east, usually in spring in New England and the mid-Atlantic, bringing a sudden drop of 10 to 20 °F with cool, damp ocean air. A squall line (instability line) is a line of thunderstorms, usually ahead of and parallel to a cold front. An outflow boundary is the leading edge of rain-cooled air spreading from thunderstorms (its leading edge is the gust front); new storms often fire along it. A shear line is a stationary front that has lost most of its temperature contrast but still has a sharp change in wind direction, common in the tropics and over the Gulf in winter.
Frontogenesis and frontolysis. Frontogenesis is the formation or strengthening of a front, a sharpening of the temperature gradient across it (for example, when winds push warm and cold air together). Frontolysis is a front's weakening or dissipation, when the gradient relaxes. A cold front that pushes far south over the warm Gulf undergoes frontolysis as the water warms and moistens the cold air until it no longer differs from the air ahead.
Mid-latitude cyclones
A mid-latitude cyclone (also called an extratropical cyclone, wave cyclone or frontal low) is a large low-pressure system, typically 1,000 to 3,000 km across, that forms along the boundary between polar and tropical air. Its energy comes from the horizontal temperature contrast between the air masses: as cold air sinks and slides under warm air that rises, potential energy is turned into the kinetic energy of the storm. Mid-latitude cyclones bring most of the precipitation of the middle latitudes, including blizzards, ice storms, nor'easters and spring severe-weather outbreaks.
Cyclogenesis is the formation or strengthening of a cyclone. It needs a baroclinic zone (a strong temperature contrast, usually a front) and upper-level divergence above the surface low, normally supplied downstream (east) of an upper trough, where positive vorticity advection and jet-streak divergence remove air from the column. Warm-air advection ahead of the low also lowers surface pressure. Cyclolysis is the weakening and death of a cyclone.
The Norwegian (polar-front) cyclone model. Developed by the Bergen school in Norway around 1918–1922, this model describes the life cycle as a sequence of stages:
| Stage | What happens |
|---|---|
| 1. Stationary front | A stationary front (the polar front) separates cold polar easterlies from warm westerly air; winds blow in opposite directions on each side |
| 2. Frontal wave (incipient cyclone) | An upper-level disturbance in the jet stream crosses the front; a kink or wave forms, with a weak low at its crest. The front becomes a cold front on the west and a warm front on the east |
| 3. Open wave | The low deepens, the counterclockwise circulation strengthens, both fronts organize and a wedge of warm air, the warm sector, lies between them, south and southeast of the center. Precipitation spreads north of the warm front and along the cold front |
| 4. Mature stage, beginning occlusion | The faster cold front starts to overtake the warm front near the low center; an occluded front forms. The storm is at or near its lowest pressure and strongest winds |
| 5. Advanced occlusion | The occluded front lengthens; the warm sector is pushed away from the center and lifted aloft; the low becomes vertically stacked under the upper low |
| 6. Dissipation (cut-off, cyclolysis) | Cut off from its warm, moist air and from upper divergence, the low fills and weakens; a new wave may form farther along the trailing cold front |
Some textbooks combine stages and list four or five (formation, open wave, occlusion, dissipation); learn the sequence rather than the count. A typical storm lives three to seven days and travels about 25 to 50 km/h (roughly 600 to 1,200 km per day), usually toward the northeast, steered by the jet stream.
The Norwegian cyclone model, stage by stage

1. Stationary frontCold and warm air side by side along the polar front.Credit: National Weather Service, Public domain, via Wikimedia Commons · source 
2. Wave formsA disturbance aloft kinks the front into a cold front and a warm front.Credit: National Weather Service, Public domain, via Wikimedia Commons · source 
3. Wave intensifiesBoth fronts organize around a warm sector.Credit: National Weather Service, Public domain, via Wikimedia Commons · source 
4. Mature, occludingThe faster cold front catches the warm front: occlusion begins.Credit: National Weather Service, Public domain, via Wikimedia Commons · source 
6. DissipatingCut off from warm air, the low fills and dies.Credit: National Weather Service, Public domain, via Wikimedia Commons · source
Where the weather is around a mature low (U.S. view). North and northeast of the low, ahead of the warm front: widespread overrunning precipitation, snow or ice in winter. Northwest of the low, in the comma head: heavy snow and strong winds (the blizzard zone). The warm sector, south and southeast of the center: warm, humid mT air, the zone of spring tornado outbreaks, especially near the triple point and ahead of the cold front. West and southwest, behind the cold front: clearing, cold, gusty northwest winds.

Where U.S. cyclones are born. The two big U.S. geographic drivers are the Rocky Mountains and the Appalachians with the warm Atlantic beside them. Lee cyclogenesis happens on the east (downwind) side of the Rockies: air crossing the mountains is squeezed vertically over the crest and stretched as it descends the lee slope, and stretching spins it up cyclonically, so lows form or deepen east of the mountains. The Gulf of Mexico and the coast near Cape Hatteras, where cold continental air meets the warm Gulf Stream, are the other main breeding grounds.
| Storm type | Where it forms | Track and speed | Moisture | Typical weather |
|---|---|---|---|---|
| Alberta clipper | lee of the Canadian Rockies in Alberta | fast (often 30 to 40 mph or more), southeast across the northern Plains and upper Midwest, then east through the Great Lakes and sometimes off the mid-Atlantic or New England coast | little (no time to tap the Gulf; mostly cP air) | a narrow swath of light to moderate snow, usually 1 to 6 inches; strong winds and blowing snow; a sharp drop in temperature and arctic air behind it; lake-effect snow afterward; mostly December to February. The same kind of storm starting in Saskatchewan is nicknamed the "Saskatchewan screamer" |
| Colorado low | lee of the Colorado Rockies (southeast Colorado and the Plains) | northeast toward the Great Lakes | taps the Gulf | most of the Midwest's moderate to heavy snowstorms; blizzards on the northwest side; severe storms in the warm sector in spring |
| Panhandle hook | Texas and Oklahoma panhandles, often as a shortwave rounds the base of a longwave trough | moves east, then hooks northeast toward the upper Midwest and Great Lakes | rich Gulf moisture | heavy snow, ice and blizzards from the central Plains to the upper Midwest; some of the most damaging U.S. snowstorms |
| Gulf low | Gulf of Mexico and the Gulf coast | northeast through the Southeast or up the Appalachians | very moist | heavy rain, ice in the Southeast, severe weather in the warm sector |
| Nor'easter (Hatteras low) | off the Carolinas along the Gulf Stream | north-northeast up the East Coast | Gulf Stream and Atlantic | heavy snow inland, coastal flooding and erosion; see Severe winter storms |
Hurricanes and mid-latitude cyclones compared. Both are low-pressure systems with counterclockwise spin in the Northern Hemisphere, converging, rising air and heavy precipitation. Almost everything else differs:
| Feature | Hurricane (tropical cyclone) | Mid-latitude (extratropical) cyclone |
|---|---|---|
| Energy source | latent heat from water evaporated off a warm ocean (≥ about 26.5 °C) | horizontal temperature contrast between air masses (baroclinic energy) |
| Core temperature | warm core: warmest at the center, at all levels | cold core: cold air aloft over the low, cold air wraps in |
| Fronts | none; nearly symmetric | yes: cold, warm and occluded fronts |
| Size | smaller; tropical-storm-force winds often within 100 to 300 km of the center, whole system several hundred km | larger, often 1,000 to 3,000 km |
| Where and when | tropical oceans, roughly 5° to 20° latitude at formation; summer and fall | 30° to 70° latitude along the polar front; strongest in late fall to spring |
| Vertical wind shear | needs weak shear; strong shear destroys it | needs strong shear and a jet stream above |
| Strongest winds | near the surface, in the eyewall | aloft, in the jet stream; surface winds spread over a large area |
| Upper levels | outflow high (anticyclone) above the storm | upper trough to the west, divergence ahead of it |
| Over land | weakens quickly (fuel cut off, more friction) | can strengthen over land |
| Eye | yes, when mature | none |
A hurricane that moves into the mid-latitudes and gains fronts and a cold core undergoes extratropical transition; it may weaken or re-intensify as a large, damaging extratropical storm.
Jet streams and upper-air charts
A jet stream is a narrow, fast current of air in the upper troposphere, thousands of kilometers long, hundreds wide and a few kilometers deep, usually blowing from west to east in both hemispheres. Core winds commonly exceed 100 mph and have topped 250 mph. Jets sit near the tropopause, around 9 to 12 km (about 30,000 to 39,000 ft; the 300 to 200 hPa levels).
Why jets exist. The sun heats Earth unevenly, so the strongest wind forms above the sharpest horizontal temperature contrast. A warm column is thicker than a cold column, so pressure surfaces slope downward from the warm side to the cold side, and the slope (and with it the pressure-gradient force) grows with height up to the tropopause. In geostrophic balance the result is westerly wind that increases with height (the thermal wind), peaking at the tropopause. Rotation adds to this: air carried poleward aloft by the Hadley cell keeps its eastward momentum while moving closer to Earth's axis, so it speeds up eastward relative to the ground.
| Jet | Latitude | Height | Why it is there |
|---|---|---|---|
| Polar-front jet | about 40° to 60°, wandering far north and south | about 9 to 12 km (300 to 250 hPa) | above the polar front, the sharp temperature contrast between polar and mid-latitude air; sits at the tropopause break between the low polar tropopause and the higher mid-latitude tropopause |
| Subtropical jet | about 20° to 30° | about 10 to 16 km (about 200 hPa) | at the poleward edge of the Hadley cell, where poleward-moving air aloft has been spun up eastward; at the tropopause break between the mid-latitude and the high tropical tropopause |
| Low-level jet | Great Plains (and elsewhere) | about 1 km (near 850 hPa) | a nocturnal southerly wind maximum that forms when daytime friction switches off; carries Gulf moisture north and feeds nighttime storms |
Seasons. Jets are strongest in each hemisphere's winter, when the temperature contrast between the poles and the tropics is largest, and they shift equatorward in winter (the polar jet often dips across the southern United States). In summer they weaken and shift poleward, with the polar jet often near the U.S.–Canada border. Severe weather follows the jet: the peak of tornado season moves from the Gulf states in early spring to the central Plains in May and the northern Plains in June as the jet migrates north.
Rossby waves. The jet does not blow in a straight line. It meanders in long (planetary) waves, also called Rossby waves, usually 3 to 7 of them around the hemisphere, each thousands of kilometers long. Their restoring force is the change of the Coriolis parameter with latitude. They move slowly, may stall, and even drift west. Smaller shortwave troughs ripple through the long-wave pattern from west to east in a day or two and trigger individual storms. On a Northern Hemisphere upper-air map, a ridge is where the jet and the height contours bulge poleward (northward, upward on the map), and a trough is where they dip equatorward (southward); warm air sits under ridges and cold air under troughs. A flow that is mostly west-to-east is zonal (mild, fast-moving weather); a strongly wavy flow is meridional (deep troughs and ridges, cold outbreaks, heat waves and stalled storms). A ridge that stalls for days, sometimes shaped like the Greek letter omega, is a blocking pattern behind many heat waves, droughts and floods. The positive phase of the Arctic Oscillation favors a zonal jet that keeps arctic air locked up north; the negative phase favors a meridional jet and cold outbreaks.
Upper divergence over surface lows. Air speeds up as it flows from the base of a trough toward the crest of the next ridge and slows as it flows from a ridge into a trough. Between an upper trough and the ridge downstream (east of the trough), air spreads apart aloft: divergence, which removes mass, lowers surface pressure and forces air to rise. Upstream of the trough (between a ridge and the trough to its east) air piles up: convergence aloft, sinking and surface high pressure. That is why storms and surface lows develop east of upper troughs and fair weather lies west of them.
Jet streaks. A jet streak is a local maximum of wind speed within a jet. Air accelerates into the entrance region and decelerates in the exit region, and the adjustment drives cross-jet circulations. For a straight jet streak in the Northern Hemisphere (looking downstream):
| Quadrant | Upper-level motion | Below it | Weather |
|---|---|---|---|
| Right entrance | divergence | rising air, falling surface pressure | clouds, precipitation, storms favored |
| Left exit | divergence | rising air, falling surface pressure | clouds, precipitation, storms favored; a favorite spot for cyclogenesis and severe outbreaks |
| Left entrance | convergence | sinking air | suppressed weather |
| Right exit | convergence | sinking air | suppressed weather |
A memory aid: "right in, left out" are the rising quadrants. A surface low under the left-exit region of a strong jet streak is in a prime position to deepen rapidly.
Upper-air charts. Above the surface, maps are drawn on constant-pressure surfaces, and the contours show the height (in meters or decameters) of that pressure surface. High heights mean warm air columns (ridges); low heights mean cold columns (troughs). Above the friction layer, winds blow nearly parallel to the height contours (low heights on the left in the Northern Hemisphere), and closely spaced contours mean strong winds.
| Chart | Approximate height | What forecasters use it for |
|---|---|---|
| 850 hPa | about 1.5 km (5,000 ft) | low-level temperature and moisture; warm- and cold-air advection; the low-level jet; the 0 °C line as a rain–snow guide; lake-effect potential (lake temperature minus 850 hPa temperature) |
| 700 hPa | about 3 km (10,000 ft) | mid-level moisture (relative humidity for precipitation forecasting) and vertical motion; the cap: a 700 hPa temperature of about +10 °C or warmer over the Plains usually suppresses surface-based storms; steering of air-mass thunderstorms |
| 500 hPa | about 5.5 km (18,000 ft) | the "middle of the atmosphere" and the forecaster's most-used chart: troughs, ridges, Rossby waves and shortwaves, steering flow, and vorticity; contours near 5,400 to 5,900 m |
| 300 and 250 hPa | about 9 and 10.5 km (30,000 and 34,000 ft) | the jet stream and jet streaks; upper divergence; isotachs (lines of equal wind speed) |
| 200 hPa | about 12 km (39,000 ft) | the subtropical jet and the tops of tropical systems; hurricane outflow |
Vorticity is the spin of the air about a vertical axis. Relative vorticity is the spin relative to Earth's surface, from curvature (air turning around a trough) and shear (wind speed changing sideways across the flow). Counterclockwise (cyclonic) spin is positive in the Northern Hemisphere and clockwise (anticyclonic) spin, as in a high, is negative. Absolute vorticity adds Earth's own spin, the Coriolis parameter :
Vorticity is analyzed on the 500 hPa chart, where maxima (vort maxes) mark troughs and shortwaves. Where the wind carries high vorticity toward lower vorticity, positive vorticity advection (PVA), found east of the 500 hPa trough axis, the air diverges aloft and rises, and clouds, precipitation and surface lows develop. Together with warm-air advection at lower levels, PVA is the forecaster's main sign of large-scale rising motion. Inside a supercell, vorticity is concentrated in the rotating updraft (the mesocyclone); that is covered in Tornadoes and waterspouts.
Thickness. The vertical distance between two pressure surfaces (usually 1000 and 500 hPa) is the thickness, and it depends only on the mean temperature of the layer: greater thickness means warmer air. The 5,400 m (540 dam) 1000–500 hPa thickness line is a classic rain–snow dividing line.
ENSO and ocean patterns
ENSO (El Niño–Southern Oscillation) is a coupled ocean–atmosphere cycle in the tropical Pacific. The ocean part is the warming (El Niño) or cooling (La Niña) of sea-surface temperatures in the central and eastern equatorial Pacific; the atmospheric part, the Southern Oscillation, is a see-saw in surface pressure between the eastern Pacific (Tahiti) and the western Pacific (Darwin, Australia). They drive each other through the Walker circulation: air rises over the warm western Pacific and Indonesia, flows east aloft, sinks over the cool eastern Pacific and returns west at the surface as the trade winds.
- Neutral conditions: strong easterly trades pile warm water in the western Pacific and drive upwelling of cold, nutrient-rich water off Peru and Ecuador; the thermocline is shallow in the east and deep in the west.
- El Niño (warm phase): the trades weaken (or reverse in the west); warm water sloshes east; upwelling off South America decreases, so coastal waters warm and fisheries collapse; the thermocline flattens; rising air and thunderstorms shift to the central and eastern Pacific; the Walker circulation weakens and the Southern Oscillation index goes negative.
- La Niña (cold phase): an exaggerated version of normal: stronger trades, stronger upwelling, colder-than-average water in the central and eastern Pacific, a stronger Walker circulation, and a stronger Pacific subtropical high.
NOAA declares El Niño or La Niña when the sea-surface temperature anomaly in the Niño 3.4 region of the central equatorial Pacific stays at or above +0.5 °C (El Niño) or at or below −0.5 °C (La Niña) for several overlapping three-month seasons, together with a matching atmospheric response. NOAA's Climate Prediction Center separates two ideas. El Niño or La Niña conditions exist when the monthly Niño 3.4 anomaly reaches ±0.5 °C, the atmosphere responds to match, and the anomaly is expected to last. An El Niño or La Niña episode is the historical label: the Oceanic Niño Index (ONI), the 3-month running mean of the Niño 3.4 anomaly, must reach +0.5 °C or warmer (or −0.5 °C or colder) for at least five consecutive overlapping 3-month seasons (for example JJA, JAS, ASO, SON, OND). So a short warm spell can produce El Niño conditions without ever becoming an El Niño episode. (Since February 2026 CPC has used the Relative ONI (RONI), the Niño 3.4 anomaly minus the average anomaly of the whole tropics (20° N–20° S), rescaled, for official monitoring; the ±0.5 °C and five-season rules are unchanged.)
The thermocline (the sharp boundary between warm surface water and cold deep water) deepens (lowers) in the eastern Pacific during El Niño, so upwelling brings up only warm water, and rises (shoals) there during La Niña, bringing cold water close to the surface. Events recur irregularly, roughly every 2 to 7 years (the strongest El Niños of recent decades were 1982–83, 1997–98, 2015–16 and 2023–24; La Niña lasted three winters in a row from 2020 to 2023); El Niño usually lasts 9 to 12 months, La Niña often one to three years.
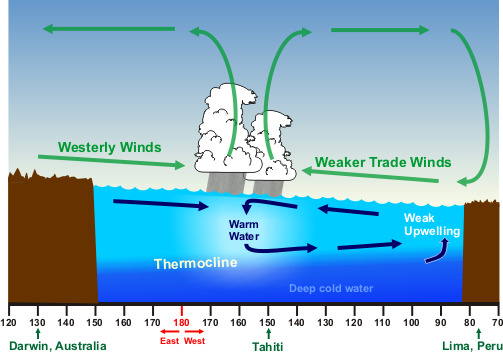
| Effect | El Niño | La Niña |
|---|---|---|
| Trade winds and upwelling | weaker; upwelling decreases | stronger; upwelling increases |
| Atlantic hurricanes | fewer: stronger upper-level westerly winds over the Caribbean and tropical Atlantic increase vertical shear | more: weaker shear |
| Eastern and central Pacific hurricanes | more and stronger | fewer |
| U.S. jet stream (winter) | strong subtropical jet across the southern U.S.; Pacific jet dips south toward California | polar jet farther north and wavier |
| U.S. winter precipitation | wetter southern tier: California, the Gulf coast, Florida; drier Pacific Northwest and Ohio Valley | drier southern tier (drought in the Southwest and southern Plains, more wildfire); wetter, snowier Pacific Northwest and Ohio Valley |
| U.S. winter temperature | milder northern tier; cooler, cloudier South | colder northern Plains; warmer South; Alaska often colder |
| Elsewhere | heavy rain and floods in Peru and Ecuador; drought in Indonesia, Australia, southern Africa; weaker Indian monsoon; global average temperature temporarily higher | the reverse: wetter Indonesia and Australia; global temperature temporarily lower |
These are tendencies, not guarantees; any single winter can break the pattern.
Other ocean–atmosphere oscillations.
- Indian Ocean Dipole (IOD): an east–west sea-surface temperature see-saw across the tropical Indian Ocean. In its positive phase the western Indian Ocean (near Africa) is warmer than normal and the eastern part (near Indonesia and Australia) cooler, bringing heavy rain and floods to East Africa and drought and bushfire weather to Australia and Indonesia; the negative phase reverses this. Positive IOD events often accompany El Niño; events usually develop in the Southern Hemisphere winter and peak in spring (about September to November).
- Madden–Julian Oscillation (MJO): an eastward-moving pulse of enhanced and then suppressed tropical clouds and rain that circles the globe in about 30 to 60 days. Its active phase favors tropical cyclone formation where it passes, and its westerly wind bursts over the western Pacific can help kick off or strengthen an El Niño; ENSO in turn changes how the MJO travels.
- Pacific Decadal Oscillation (PDO): a pattern of North Pacific sea-surface temperatures that stays in one phase for decades rather than ENSO's months to a couple of years; a warm (positive) PDO tends to reinforce El Niño-like U.S. impacts and a cool PDO La Niña-like ones.
Oceans and large lakes
Warm water is fuel. Ocean heat content, the heat stored in the upper ocean, matters more to a hurricane than the surface temperature alone: a storm mixes up water from below, and if the warm layer is shallow, it brings up cold water and weakens itself. That stirred, cooled track left behind a hurricane is its cold wake, and a slow or stalled storm can sit over its own wake and weaken. Ocean currents such as the Gulf Stream and the Loop Current carry heat poleward and can fuel rapid intensification when a storm crosses them. Fetch, the distance wind blows over open water, controls wave height and, for lake-effect snow, how much heat and moisture the air picks up before reaching shore.
Heat content, not just surface temperature. Forecasters map tropical cyclone heat potential, the heat stored in water warmer than 26 °C, which depends on how deep the 26 °C isotherm lies. Over the Loop Current or a warm eddy, warm water can reach 100 m or more, so a hurricane's churning cannot bring up cold water and rapid intensification is favored. Over a thin warm layer, the same storm mixes up cold water within hours. The resulting cold wake is often 1–5 °C cooler than the surrounding sea, shows on satellite sea-surface-temperature maps for one to several weeks, and can weaken a second storm that follows the same track. Heat transport: the Gulf Stream and Loop Current carry tropical heat poleward, and the Gulf Stream's warm edge is where many nor'easters deepen.
The same high specific heat that makes oceans slow to warm makes them slow to cool, so the Gulf of Mexico and the Gulf Stream stay warm into fall and winter. Cold continental air crossing the Gulf Stream is heated and moistened from below, which is why nor'easters and East Coast winter storms deepen so quickly offshore. The Gulf of Mexico is the moisture source for nearly all severe weather east of the Rockies: southerly winds on the west side of the Bermuda High carry its humid mT air north. The Great Lakes do the same on a smaller scale, unfrozen and much warmer than arctic air in late fall and early winter, which is why lake-effect snow peaks then and fades once the lakes cool or freeze.
Atmospheric rivers
An atmospheric river (AR) is a long, narrow corridor of strong water-vapor transport in the lower troposphere, typically about 400 to 600 km (250 to 375 miles) wide and often more than 1,600 km (1,000 miles) long. ARs carry moisture from the tropics and subtropics toward higher latitudes, usually along the warm side of a mid-latitude cyclone's cold front, and together they carry the large majority (around 90%) of the water vapor moving poleward through the middle latitudes. An average AR transports about as much water as the average flow at the mouth of the Mississippi River; the strongest carry up to about 15 times as much. Most of the vapor travels in the lowest 1 to 3 km, which is why mountains wring so much out of it.
The best-known example is the Pineapple Express, an AR that draws tropical moisture from near Hawaii to the U.S. West Coast. When an AR strikes the coastal ranges and the Sierra Nevada, orographic lift forces the moist air up and produces extreme rain and snow, especially from fall through winter. ARs supply a large share (often 30 to 50%) of the West Coast's yearly precipitation and refill its snowpack and reservoirs, so they are vital water sources; but a slow-moving or stalled AR causes floods, mudslides and debris flows, as in the California storms of 2017 that damaged the Oroville Dam spillway. A long, gentle rain recharges soil and groundwater better than an intense burst that mostly runs off.
ARs are identified by integrated water vapor transport (IVT), the total horizontal flux of vapor through the atmospheric column, in kg per meter per second; a common threshold for an AR is about 250 kg m⁻¹ s⁻¹. The AR scale (AR 1 to AR 5) ranks events from weak and mainly beneficial to exceptional and mainly hazardous, using the IVT and how long it lasts at one place. Satellite images of integrated water vapor show ARs as long plumes stretching across the ocean. ARs are not jet streams: they are rivers of moisture, although they lie beneath and are steered by the low-level and upper jets.
Terrain
Mountains lift air (orographic lift), so windward slopes get heavier rain and snow, and leeward sides lie in a rain shadow. Terrain can focus flash floods in steep canyons, strengthen downslope windstorms, and weaken hurricanes that cross mountainous islands by cutting off their warm, moist inflow and disrupting their circulation. On the Plains, the gentle upslope toward the Rockies helps lift moist air on spring afternoons.
How a rain shadow forms. Two things happen as air crosses a range. On the windward side the air rises, cools at the dry rate to its LCL, then at the slower moist rate as clouds form, and much of its water falls out as rain or snow. On the leeward side the air descends and warms by compression at the full dry adiabatic rate, because it has no cloud left to evaporate. It therefore reaches the lee foothills both drier (it has lost moisture) and warmer than it started (it gained the latent heat released when its vapor condensed and fell out). Warm, dry, sinking air gives clear skies and little rain, so deserts and dry grasslands lie in the lee of mountains: east of the Sierra Nevada (Nevada's Great Basin and Death Valley), east of the Cascades (eastern Washington and Oregon), the High Plains east of the Rockies, and the leeward sides of the Hawaiian islands. On the windward side the wet slopes are lush and forested.


Downslope winds. The same descent drives warm, dry foehn winds (Chinook, Santa Ana) and, off cold plateaus and ice sheets, cold katabatic winds; both are compared in Downslope and mountain winds.
Upslope flow. Air pushed up a gentle rising slope cools and can produce clouds, drizzle, freezing fog or snow even without a storm. On the High Plains, easterly winds behind a cold front flow upslope toward the Rockies and produce heavy upslope snow in Denver and along the Front Range; in spring the same upslope flow helps lift moist air into the first storms of the day. Mountains also anchor thunderstorms: daytime heating of slopes drives upslope (anabatic) winds that converge over the peaks and start afternoon storms, which then drift off downwind. Hurricanes hitting the mountains of Hispaniola, Cuba, Taiwan or Mexico weaken because the terrain disrupts their low-level circulation, but the same uplift wrings out catastrophic rain, floods and mudslides on the windward slopes.
Severe-weather clouds
The rules limit clouds to those tied to severe weather, but tests still expect enough of the basic cloud families to place a cumulonimbus among them, and they love matching questions on the storm's accessory clouds. Learn what each cloud says about the air that made it. The cloud-family table is background for placing the cumulonimbus, not an identification list: non-severe clouds are outside the 2027 outline.
Cloud families and levels
Clouds are named from four Latin roots: cumulus (heap), stratus (layer), cirrus (curl of hair) and nimbus (rain-bearing), plus alto- for the middle level. They are grouped by the height of their base:
| Group | Base height (mid-latitudes) | Clouds | Made of | Precipitation |
|---|---|---|---|---|
| High | about 5–13 km (16,500–45,000 ft) | Cirrus (Ci), cirrostratus (Cs), cirrocumulus (Cc) | Ice crystals (fuzzy, fibrous edges) | none reaching the ground |
| Middle | about 2–7 km (6,500–23,000 ft) | Altostratus (As), altocumulus (Ac) | Water droplets, often supercooled, some ice | As: light rain or snow (often virga); Ac: rarely |
| Low | surface to about 2 km (6,500 ft) | Stratus (St), stratocumulus (Sc), nimbostratus (Ns) | Water droplets | St: drizzle, snow grains; Sc: light showers; Ns: steady rain or snow |
| Vertical development | base low (often 1–2 km), top up to the tropopause | Cumulus (Cu), towering cumulus (Cu congestus), cumulonimbus (Cb) | Droplets below, ice above | Cu: none; congestus: showers; Cb: heavy showers, hail, thunder |
Cumulus and cumulonimbus are the two clouds not tied to one level, because they grow through several. Nimbostratus is listed as low or middle depending on the source; it is the thick, gray, featureless layer of a warm front and the cloud to watch for a long steady snow.
Cumuliform versus stratiform. The difference is stability, not location.
| Feature | Cumuliform | Stratiform |
|---|---|---|
| How the air rises | Buoyant bubbles (convection) in unstable air, fast vertical motion (meters per second, up to 50 m/s in supercells) | Gentle, widespread lifting of stable air (centimeters per second), e.g. warm-front overrunning |
| Shape | Puffy, heaped, cauliflower tops, flat bases, gaps of blue sky | Flat, layered, featureless sheets covering large areas |
| Precipitation | Showery: heavy, brief, starts and stops; hail possible | Steady: light to moderate, long-lasting, widespread |
| Turbulence and visibility | Bumpy air; good visibility between clouds | Smooth air; haze, fog and poor visibility trapped under inversions |
| Examples | Cumulus, congestus, cumulonimbus, altocumulus castellanus | Stratus, nimbostratus, altostratus, cirrostratus |
Why the tallest cloud is the brightest. A deep cumulonimbus reflects most of the sunlight that hits it (albedo around 0.9), so it has the highest albedo of any cloud and looks brilliant white on visible satellite images; it also has the greatest depth from base to top (10–15 km or more) and the coldest tops on infrared images. Thin cirrus, by contrast, lets most sunlight through, so it looks gray on visible imagery yet can look as cold as a storm top on IR (see Satellite imagery). Clouds stay up because cloud droplets (about 0.01–0.02 mm across) fall only about 1 cm/s, far slower than the rising air around them; precipitation must grow about a million times in volume before it falls out (see How precipitation forms).
From cumulus to cumulonimbus
A thunderstorm cloud passes through a recognizable sequence:
- Cumulus (humilis, then mediocris). Fair-weather puffs with flat bases at the lifting condensation level. If a stable layer caps them, they stop here.
- Towering cumulus (cumulus congestus). Taller than wide, hard cauliflower tops, typically reaching 6 km (about 20,000 ft). This is the WMO name (TCU in aviation reports) tests ask for in the developing stage. Showers can fall from it, but no lightning yet.
- Cumulonimbus calvus ("bald"). The top has started to freeze and soften but is not yet fibrous. The first lightning usually appears near this point.
- Cumulonimbus capillatus ("hairy"). The top has turned into fibrous ice (cirriform). With a spreading anvil it is cumulonimbus capillatus incus (incus = anvil). Mature cumulonimbus tops typically reach 12–15 km (40,000–50,000 ft) in mid-latitudes, up to about 18 km (60,000 ft) in the tropics.
Why the anvil spreads. A rising parcel stays buoyant only while it is warmer than its surroundings. At the tropopause the temperature stops falling (it rises with height in the stratosphere), so the parcel suddenly becomes colder than its environment, loses buoyancy and spreads sideways. Strong winds near the tropopause (the jet stream level) carry the ice downwind, so the anvil leans downwind and can stretch hundreds of kilometers (over 100 miles) from the parent storm; large mesoscale systems merge their anvils into shields hundreds of kilometers across. An overshooting top is a dome bulging above the anvil where the updraft's momentum carries it into the stratosphere for a few minutes; a persistent one marks a very strong updraft and a likely severe storm. A lower tropopause (in winter or at high latitude) means shorter storms and, for hurricanes, a weaker maximum intensity.
Pyrocumulonimbus. Intense heat from a large wildfire (or a volcanic eruption) can drive a cumulonimbus of its own, gray-brown with smoke at its base. It can produce lightning that starts new fires, erratic outflow winds that spread the fire, and it can inject smoke into the lower stratosphere. It forms from an intense surface heat source, not from a front.
Accessory clouds and features
| Cloud or feature | What it looks like | What it means |
|---|---|---|
| Cumulonimbus | Towering cloud with a flat, spreading top | The thunderstorm cloud; produces lightning, heavy rain, hail |
| Anvil (incus) | Flat ice-crystal shelf spreading downwind at the tropopause | The updraft has hit the stable stratosphere and spread out; can reach 100+ miles downwind |
| Overshooting top | Dome rising above the anvil | A very strong updraft punching into the stratosphere; a sign of severe weather |
| Mammatus | Pouch-like lobes hanging under the anvil | Cold, cloudy air sinking into drier air beneath the anvil; common with strong storms, usually seen as the storm moves away; not itself a tornado sign |
| Pileus | Smooth, thin cap cloud draped over a rising tower | A rapidly rising updraft pushes a moist layer above it to saturation; the tower usually punches through |
| Wall cloud (murus) | Abrupt, persistent lowering under the rain-free base, often rotating, a fraction of a mile to nearly 5 miles across | Moist, rain-cooled air drawn into a supercell updraft; usually on the south or southwest (inflow) side; tornadoes most often form from rotating wall clouds |
| Tail cloud (cauda) | Horizontal band of cloud extending from the wall cloud toward the precipitation core | Moist outflow-cooled air being drawn into the updraft; strong inflow |
| Beaver tail (flumen) | Smooth, flat inflow band along the storm's inflow side, toward the updraft | Strong low-level inflow into a supercell |
| Clear slot | A slot of clearing wrapping around the wall cloud | The rear-flank downdraft descending and drying the air; it can precede tornado formation |
| Rain-free base | Dark, flat, rain-free cloud base | The main updraft base of a supercell, with the wall cloud below it |
| Flanking line | Row of growing cumulus stepping up toward the main tower | New updrafts along the gust front feeding a supercell |
| Shelf cloud (arcus) | Low, wedge-shaped cloud on the leading edge of a storm, attached to it; smooth, terraced top, turbulent ragged underside | Warm air lifted over the gust front; strong straight-line winds follow; common on squall lines and multicells |
| Roll cloud (arcus volutus) | Detached, horizontal tube-shaped low cloud that appears to roll about a horizontal axis | Formed along an outflow boundary or gust front; not attached to the storm, not a tornado |
| Scud (fractus) | Ragged, low cloud fragments beneath a storm, not rotating | Lifted moist air near the outflow; the classic false tornado report |
| Funnel cloud (tuba) | Rotating condensation funnel not touching the ground | A tornado once the circulation reaches the ground (check for a debris whirl under it) |
| Virga | Streaks of precipitation that evaporate before reaching the ground | Dry air below cloud base; evaporative cooling can drive a microburst |


Severe thunderstorms
A thunderstorm is any storm that produces thunder, so by definition it has lightning: no lightning, no thunder. The NWS calls a thunderstorm severe when it produces any of: hail 1 inch or larger in diameter, wind gusts of 58 mph (50 kt) or more, or a tornado. Heavy rain, flash flooding and frequent lightning are dangerous but do not by themselves make a storm severe.
What a thunderstorm needs
- Moisture in the lowest 1–2 km: it forms the cloud and, more importantly, releases latent heat as it condenses, which keeps the rising air warmer than its surroundings. Condensation releases heat and fuels the storm; evaporation and melting absorb heat and cool the downdraft.
- Instability: a lifted parcel that becomes warmer than its environment keeps rising on its own. Steep lapse rates aloft and warm, humid air near the ground mean high CAPE. If energy at the ground could be split between warming the air (sensible heat) and moistening it (latent heat), moistening helps more: it lowers the cloud base and adds latent heat to release.
- Lift: a trigger such as surface heating, a front, a dryline, an outflow boundary, sea-breeze convergence or mountains.
- Shear (for severe storms): winds that change speed and direction with height tilt the updraft so that rain falls beside it instead of into it, separating the updraft from the downdraft. That is why sheared storms live for hours.
Thunderstorms move with the average wind of the cloud layer (roughly the 700–500 hPa wind), so in the mid-latitude westerlies most move from west or southwest toward the east or northeast. A storm's arrival time is simply distance ÷ speed.
The air-mass thunderstorm life cycle
The ordinary, air-mass or single-cell thunderstorm is a scattered, isolated storm in warm, humid air with weak shear: the "popcorn" storm of a summer afternoon. It is usually not severe. One cell lives about 30 to 60 minutes and passes through three stages:
| Stage | Vertical motion | What you see | Typical length |
|---|---|---|---|
| Cumulus (developing, towering cumulus) stage | Updrafts only, growing stronger; air is drawn in from the sides (entrainment begins) | Cumulus grows into towering cumulus; little or no precipitation reaches the ground; no lightning until late in the stage | about 10–15 min |
| Mature stage | Updrafts and downdrafts side by side; begins when precipitation first falls from the base | Cumulonimbus with an anvil and sometimes an overshooting top; heaviest rain, hail, most frequent lightning, strongest gusts; cold outflow spreads as a gust front; dry air entrained into the cloud evaporates drops, cooling the air and strengthening the downdraft | about 15–30 min |
| Dissipating stage | Downdrafts dominate | The cold outflow spreads under the storm and cuts off the warm, moist inflow; light rain, fewer flashes; the anvil and the upper cloud (above the freezing level) linger | about 10–20 min |
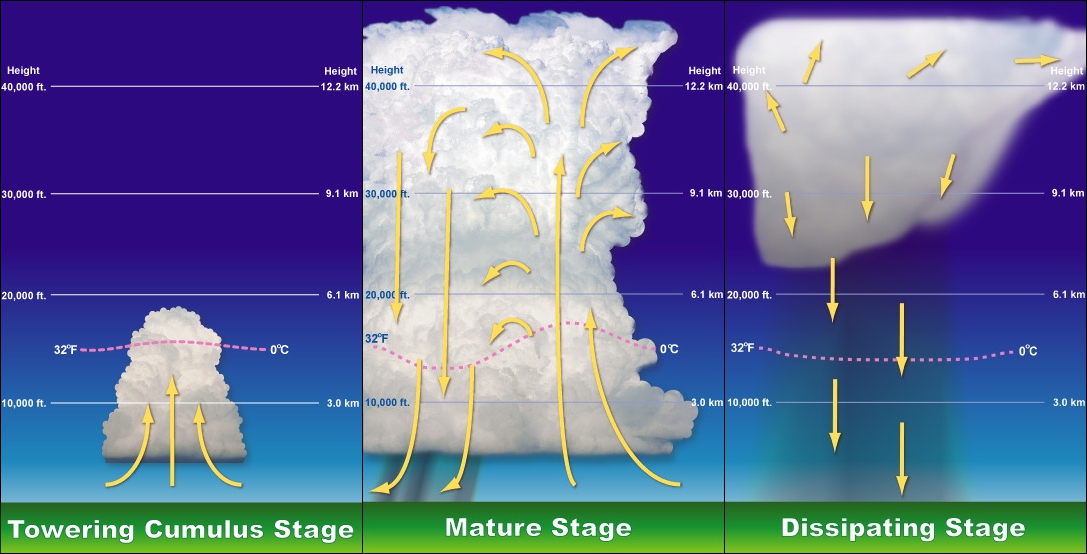
Why it kills itself. With weak shear the updraft is nearly vertical, so the rain and hail it builds fall straight back down through it. The falling precipitation drags air down (precipitation loading), and evaporation and melting chill that air, making it denser. The downdraft spreads through the cloud and along the ground, and the storm runs out of warm, moist fuel. It does not die because its charge is used up, because all the water freezes, or (directly) because the sun sets.
A thunderstorm stabilizes the air it leaves behind. Convection is the atmosphere's way of overturning an unstable column: the updraft carries warm, moist air up and releases latent heat aloft, warming the upper levels, while the rain-cooled downdraft spreads a pool of cold, dense air at the surface. Warmer air above colder air means a smaller lapse rate, so after a storm passes the local atmosphere is more stable (CAPE used up), and new storms rarely form in the rain-cooled air until the sun or a new air mass rebuilds the instability. The outflow's edge, however, can lift unstable air outside the cold pool and trigger new cells there.
Entrainment is the mixing of drier environmental air into a cloud through its sides and top. It dilutes the updraft's buoyancy, so small clouds and very dry environments weaken storms; it also feeds evaporation that strengthens the downdraft. Entrainment starts in the cumulus stage but matters most in the mature stage; a question asking for one stage usually wants mature.
Storm types: single cell to supercell
| Type | Structure | Shear | Life span | Typical hazards |
|---|---|---|---|---|
| Single-cell ("pulse", air-mass, popcorn) | One updraft and downdraft; rain falls back into the updraft | Weak | 30 to 60 minutes | Brief heavy rain, lightning; a "pulse" storm can briefly produce hail or a microburst |
| Multicell cluster | A group of cells at different stages; each cell's outflow lifts air on the gust front to trigger the next, usually on the storm's south or southwest flank | Moderate | Hours, as a system (each cell about 30–60 min) | Moderate hail, flash floods, gusty winds, weak tornadoes |
| Multicell line (squall line) | A long line of cells along a gust front or ahead of a cold front, often with a trailing stratiform rain region | Moderate, mostly perpendicular to the line | Hours | Damaging straight-line winds, bow echoes, heavy rain, brief tornadoes, small to moderate hail |
| Supercell | One long-lived, rotating updraft (a mesocyclone) | Strong, turning with height | 1 to 4+ hours | Very large hail, violent tornadoes, damaging winds, flash floods |
| Mesoscale convective system (MCS) | Any organized cluster or line of storms ≥ about 100 km across with a shared rain shield (squall lines, bow echoes, MCCs) | Variable | 3 to 12+ hours | Widespread wind, heavy rain, flooding |
Multicells. In a multicell cluster the newest cell is usually on the upwind side (often southwest) and the oldest downwind, so the cluster can drift differently from its individual cells. When new cells keep forming on the upwind edge and moving over the same ground (back-building), or when cells move along a line like train cars (training), rain totals pile up and flash floods follow. Multicells do not usually produce strong tornadoes.
The NWS JetStream lesson groups storms into four basic types: single-cell, multicell cluster, multicell line (squall line) and supercell; MCSs are the larger organized systems built from them.
Colliding outflows and upscale growth. Each storm's cold outflow spreads out as a gust front. Where two outflow boundaries collide or merge, or an outflow boundary meets a front, dryline or sea breeze, the converging air is forced up much more strongly than along either boundary alone, and new, often stronger cells erupt right at the intersection. As scattered afternoon storms produce more outflow, their cold pools merge into one large pool; its leading edge lifts warm, moist air continuously along a single long gust front, and the separate cells organize into a line or cluster sharing one anvil and rain shield. This upscale growth from individual cells into a mesoscale convective system typically happens in the evening, and the nocturnal low-level jet keeps the MCS fed overnight. Storms that form where outflows intersect or merge are good candidates for severe weather and for a new storm complex.
Squall lines. A squall line is a line of thunderstorms, often 100 to 1,000 km long. It can form along a cold front, or as a pre-frontal squall line up to about 100–300 km ahead of it, often along a dryline or an outflow boundary. Its structure (see the figure):
- A leading convective line of tall cells with the heaviest rain and hail, preceded by a shelf cloud on the gust front.
- A trailing stratiform region behind the line: a wide area of steady, lighter rain from the old cells' anvils.
- Front-to-rear flow rising through the line and streaming back aloft, and a rear-inflow jet descending beneath it from the back of the system. When the rear-inflow jet reaches the ground it pushes part of the line forward into a bow echo, with the most damaging winds at the bow's apex (see Wind signatures on radar).
Squall lines are less likely than supercells to produce tornadoes, and their tornadoes are usually brief and weaker; their main threat is straight-line wind.

MCC, MCS, squall line and derecho: four words that are not synonyms. An MCS is the general term for any large organized storm system. A squall line is an MCS shaped as a line. A mesoscale convective complex (MCC) is a large, roughly round MCS with a formal satellite definition (Maddox, 1980): a cold cloud shield of at least 100,000 km² colder than −32 °C, with an inner core of at least 50,000 km² colder than −52 °C, lasting at least 6 hours, and nearly round in shape (minor-to-major axis ratio at least 0.7). MCCs form mostly in summer, grow overnight on the Great Plains fed by the southerly low-level jet, and produce widespread heavy rain and flash flooding more than violent severe weather; they often leave behind a mesoscale convective vortex that can seed new storms the next day. A derecho is not a storm shape but a damage outcome: a long swath of wind damage from a fast-moving MCS, usually a bow echo or a series of bows (see Damaging winds).
Supercell structure
A supercell is a thunderstorm with a deep, persistent, rotating updraft called a mesocyclone, typically 2–10 km (1–6 mi) across. Supercells are the least common storm type but produce most large hail and nearly all strong and violent tornadoes.
Why the updraft rotates. Vertical wind shear creates horizontal spin in the air near the ground, like a pencil rolling between two hands moving at different speeds. The updraft tilts that horizontal rotation into the vertical and stretches it, which spins it faster. When the low-level winds veer (turn clockwise) with height, the inflow air's spin points along its direction of motion (streamwise vorticity), and the updraft acquires rotation directly. Shear also keeps the updraft tilted, so precipitation falls downshear, away from the inflow, and the storm can live for hours. (Hodographs and storm-relative helicity, which measure this, are in Hodographs.)
Supercell updrafts are the strongest in any storm: commonly 25–40 m/s (about 55–90 mph), and in extreme cases over 50 m/s (more than 100 mph), fast enough to hold up giant hail.
The parts of a classic supercell, from the inflow side around to the back:
| Part | Where and what |
|---|---|
| Main updraft and rain-free base | Usually on the south or southwest (right-rear) side relative to motion; warm, moist inflow enters from the southeast |
| Mesocyclone | The rotating updraft, 2–10 km wide, extending through much of the storm's depth |
| Wall cloud | Lowering beneath the mesocyclone at the rain-free base |
| Forward-flank downdraft (FFD) | The main downdraft with the most precipitation, under the anvil ahead (downwind) of the updraft: heavy rain and hail |
| Rear-flank downdraft (RFD) | Drier, sinking air on the back (upwind) side that wraps around the mesocyclone; it forms the clear slot and, on radar, helps shape the hook. The RFD and its gust front help tighten the rotation and promote tornadogenesis |
| Gust fronts | The leading edges of the FFD and RFD outflows; the RFD gust front wraps around and meets the FFD gust front, and tornadoes usually form near this occlusion, close to the updraft (the junction of the two gust fronts with the warm inflow is the triple point) |
| Flanking line | Line of cumulus towers along the RFD gust front, stepping up toward the main updraft |
| Bounded weak echo region (BWER) | A radar "vault" of weak echo inside the updraft, capped by heavy echo aloft, because air rises too fast for precipitation to form; hail grows around its edges (see Radar signatures of severe storms) |
| Anvil, overshooting top, mammatus | Aloft and downwind; a persistent overshooting top marks the strongest updraft |
On radar, rain wrapping around the mesocyclone makes the hook echo on the right-rear flank, and warm inflow enters at the inflow notch beside it.
Classic, LP and HP supercells. Supercells come in a spectrum based on how much precipitation falls near the updraft.
| Type | Precipitation | Where and when | Look | Main hazards |
|---|---|---|---|---|
| Low-precipitation (LP) | Little rain; precipitation falls well away from the updraft | High Plains, near the dryline, drier air | Sculpted, often striated "barber-pole" updraft, easy to see; little or no hook on radar | Large hail (often in sparse, very large stones), funnel clouds and wall clouds; occasional tornadoes, usually weak to strong; little rainfall |
| Classic | Moderate; heavy core in the forward flank, rain-free base under the updraft | Plains | Textbook structure: wall cloud, clear slot, flanking line, hook echo | Large hail, damaging winds, the strongest and most long-lived tornadoes |
| High-precipitation (HP) | Heavy rain wraps all the way around the mesocyclone | Moister air: eastern Plains, Midwest, Southeast | Dark, rain-wrapped; kidney-bean or broad hook on radar | Rain-wrapped tornadoes (very hard to see), flash flooding, destructive hail and wind |
Right-movers and splits. In strong shear, a new storm often splits in two. In the Northern Hemisphere, when the hodograph curves clockwise (winds veer with height), the right-moving member, with a cyclonic (counterclockwise) mesocyclone, is favored. It moves to the right of the mean wind (often toward the east or southeast while the winds blow toward the northeast), which carries it into fresh warm inflow; most tornadic supercells are right-movers. The left-mover rotates anticyclonically and seldom produces tornadoes. Not every mesocyclone makes a tornado: only a minority, roughly a quarter or fewer, do.
Where and how often thunderstorms happen
- Worldwide: about 16 million thunderstorms a year, roughly 2,000 in progress at any moment (about 40,000–45,000 a day). Lightning is most frequent over tropical land: central Africa (Congo basin) and Lake Maracaibo in Venezuela lead the world.
- United States: about 100,000 thunderstorms a year, of which about 10% reach severe criteria.
- Most thunderstorm days: Florida. Central Florida has 70 to more than 100 thunder days a year, because sea breezes from both coasts converge over the peninsula every summer afternoon in very moist air. The Tampa–Orlando corridor is called "Lightning Alley", and Florida leads the states in lightning density and lightning deaths. The Gulf Coast and the Rocky Mountain Front Range (daily upslope storms) are next; the Pacific coast has the fewest.
- Severe reports are not spread like thunder days. Large hail peaks on the Great Plains and High Plains (from Texas to the Dakotas, with the most frequent hail where Colorado, Nebraska and Wyoming meet), tornadoes in the Plains and the Southeast, and wind damage reports are most numerous from the Midwest and Ohio Valley to the Southeast and Mid-Atlantic, partly because more people and trees are there to report and be damaged. Severe weather peaks in spring (South) and early summer (northern Plains and Midwest).
- Time of day: ordinary storms form in the afternoon (peak heating, around 3 to 7 p.m. local time); Plains MCSs peak overnight; over the ocean, storms peak near dawn.
Lightning
Lightning is a giant electrical discharge that neutralizes charge built up inside a thunderstorm. Every thunderstorm makes lightning, which is what makes the thunder. About 25 million cloud-to-ground flashes strike the United States each year, and the whole planet sees about 40 to 50 flashes per second.
How clouds become electrified
The accepted mechanism is the non-inductive (graupel–ice) collision mechanism, sometimes called the precipitation theory:
- In the mixed-phase part of the cloud, between 0 °C and about −40 °C, supercooled droplets, small ice crystals and graupel (soft hail, rimed ice) coexist.
- Updrafts carry crystals up past falling or suspended graupel. When an ice crystal bounces off a graupel particle, a small charge is transferred. Below a "reversal temperature" of about −10 to −15 °C (depending on the liquid water present), the graupel gains negative charge and the crystal positive; at warmer temperatures the signs reverse.
- The updraft lifts the light, positive crystals to the upper cloud and anvil. The heavy, negative graupel stays in the middle (the main negative region, about −10 to −25 °C). Graupel charged positive in the warmer lower region makes a small lower positive charge near cloud base.
- The surface under the storm develops a positive induced charge that follows the storm like a shadow; under the far anvil, the ground is negative.
The older convection theory says air currents carry ions (from cosmic rays and from the ground, lifted by updrafts) up and down the cloud to separate charge. It may contribute, but cannot by itself explain the strong charging; collisions between precipitation particles are the main cause. Things that do not cause electrification: friction of air on raindrops, "volatile" electrons, lightning from evaporation.
How deep must the cloud be? Electrification needs ice, graupel and supercooled water together, plus an updraft strong enough to keep them colliding and to separate them. In practice a cloud starts producing lightning only when it extends well above the freezing level, roughly 3 km or more into sub-freezing air, so that its top is colder than about −20 °C and its total depth is typically 6 km or more, with updrafts of at least several meters per second. That is why shallow warm-rain showers and winter stratiform clouds rarely make lightning, while towering cumulus becomes electrified as it turns into cumulonimbus (calvus).

Anatomy of a cloud-to-ground flash
Air is a good insulator; it takes a field of about 3 million volts per meter (at sea level) to break it down, though lightning starts at lower fields with the help of ice particles.
- Stepped leader. A faint, negatively charged channel of ionized air zigzags downward from the cloud base in steps of about 50 m, pausing briefly between steps and often branching, searching for the path of least resistance. It is nearly invisible to the eye and takes a few hundredths of a second to approach the ground.
- Streamers. As the leader nears the ground (within about 30–100 m), the strong field pulls positive streamers up from tall, pointed objects: trees, poles, towers, people.
- Return stroke. When a streamer meets the leader, the circuit is complete and a huge current (typically about 30,000 amperes) surges upward from the ground to the cloud along the channel at roughly a third of the speed of light. This brilliant return stroke is the flash you actually see. Negative charge is lowered from the cloud to the ground, but the luminous wave travels from the ground up.
- Dart leaders and subsequent strokes. If charge remains, a dart leader runs down the still-warm channel smoothly and fast, without stepping, and triggers another return stroke. A typical flash has 3 or 4 strokes about 40–50 milliseconds apart, which is why lightning flickers.
A flash is the whole discharge; a stroke is one return stroke within it. The channel itself is only about 1–3 cm wide but heats to about 50,000 °F in microseconds.
Thunder. The sudden heating raises the pressure in the channel to many times normal; the air expands explosively, sending out a shock wave that decays into the sound wave we hear. A clap or crack means a nearby strike; rumbling comes from sound reaching you from different parts of a long channel at different times. Thunder is usually audible up to about 10 miles (15 km); flashes farther than that are seen without thunder.
Types of lightning
| Lightning type | What happens |
|---|---|
| Intracloud (in-cloud) | Discharge between charge regions inside one cloud; the most common type, about 75–80% of all flashes |
| Cloud-to-cloud (intercloud) | Discharge between two clouds |
| Cloud-to-air | Discharge from the cloud into clear air around it |
| Negative cloud-to-ground | About 90% of ground strikes; lowers negative charge from the middle of the cloud |
| Positive cloud-to-ground | From the positive upper cloud or anvil (often called anvil lightning); under 10% of ground strikes but with higher peak current and a longer continuing current, so it starts more fires and damages more; common in the trailing stratiform region of MCSs, in winter storms and in some severe storms |
| Ground-to-cloud (upward) | Starts from tall towers, skyscrapers or wind turbines and branches upward; can be either polarity |
| Staccato lightning | A cloud-to-ground flash with a single, short, very bright stroke (no long continuing current), often heavily branched; common near the main updraft and a sign of a vigorous storm |
| "Bolt from the blue" | A positive or negative strike that leaves the side or anvil of the storm, travels out horizontally and hits ground under clear sky up to 10 miles or more from the storm |
| Anvil crawler (spider lightning) | Long, slow, branching horizontal flashes crawling across the underside of the anvil or stratiform cloud |
| Sheet lightning | Not a different discharge: in-cloud lightning hidden inside the cloud, so the whole cloud lights up without a visible channel |
| Heat lightning | Lightning from a storm too far away (often more than about 10–15 miles, or 20 km) for its thunder to be heard; it has nothing to do with heat |
| Dry lightning | Lightning from high-based storms whose rain evaporates before reaching the ground (virga); a major wildfire starter in the West |
| Ribbon and bead lightning | Optical effects: wind spreading the channel between strokes (ribbon); a channel breaking into glowing beads as it fades (bead) |
| Ball lightning | A rare, poorly understood glowing sphere (bluish-white, yellow or red, usually golf-ball to beach-ball size) reported floating near the ground during storms for several seconds, sometimes with a sulfur smell; its very existence was long disputed and its cause is still unknown |
| St. Elmo's fire | Not lightning but a steady corona discharge: a blue-violet glow on pointed objects (ship masts, aircraft wings, towers) when the electric field near the ground is strong; it means a strike may be close |
Transient luminous events (TLEs) are brief flashes above thunderstorms, triggered by strong lightning below:
| TLE | Height | Look | Trigger |
|---|---|---|---|
| Red sprites | about 50–90 km (30–55 mi), tendrils reaching down toward the cloud top | Red-orange, jellyfish or carrot shapes lasting milliseconds | Large positive cloud-to-ground strokes |
| Elves | about 90 km, in the lower ionosphere | Expanding red ring up to about 400 km (250 mi) across, lasting under a millisecond | The electromagnetic pulse of a powerful stroke exciting nitrogen |
| Blue jets | From cloud top up to about 40–50 km | Narrow blue cones shooting upward | Charge imbalance at the storm top |
| Gigantic jets | Cloud top to about 90 km | Jets that connect the storm to the ionosphere | Rare, from tall storms |
Detecting lightning
Ground-based networks such as the National Lightning Detection Network (NLDN) detect the radio waves (low-frequency electromagnetic pulses) from the strong currents in lightning channels. Each strike's location comes from combining the direction to it measured by magnetic direction finders with the time of arrival of its pulse at several sensors. Lightning Mapping Arrays of a dozen or so antennas tens of kilometers apart record the arrival time of very high frequency (VHF) radiation from every step of a flash, mapping the flash in 3-D inside the cloud. From space, the Geostationary Lightning Mapper (GLM) on GOES satellites records the optical flashes of all lightning, including intracloud, day and night across the Americas. A sudden jump in the total flash rate (a "lightning jump") often comes 10 to 20 minutes before severe weather because it tracks a strengthening updraft and more graupel aloft.
Lightning distance and safety
Light arrives essentially instantly (300,000 km/s), so the delay between flash and thunder is the travel time of sound. The speed of sound depends on air temperature:
If the flash is high in the cloud and the question gives both the straight-line distance and the height, the sound's travel time uses the straight-line distance ; the horizontal distance to the point under the flash is . If instead the horizontal distance and height are given, the sound travels , never just . A wind blowing from the flash toward you adds its speed to the speed of sound (a wind blowing toward the flash subtracts it); 32 mph is about 14 m/s, a 4% effect.
Lightning safety in brief (the full list of protective actions is in Preparedness and actions):
- Lightning can strike 10 miles or more from a storm, about as far as thunder can be heard: "When thunder roars, go indoors."
- 30/30 rule: if the flash-to-bang time is 30 seconds or less (about 6 miles), get to shelter now, and stay there until 30 minutes after the last thunder. Lightning is often the first storm hazard to arrive and the last to leave.
- Safe places: an enclosed building with plumbing and wiring, or a hard-topped metal vehicle (the metal shell carries current around you, not the tires). Unsafe: open fields, hilltops, under isolated trees, open shelters, water.
- A person struck by lightning carries no charge and is safe to touch; give CPR if they are not breathing.
Lightning statistics. The NWS puts the odds of being struck by lightning at about 1 in 1.2 million in a given year and about 1 in 15,300 over an 80-year lifetime (2009–2018 averages). The United States now averages about 20 lightning deaths a year (down from more than 300 a year in the 1940s), most of them outdoors in summer, and men far outnumber women. Worldwide, lightning kills thousands a year. Lightning starts many wildfires, especially in the West through dry lightning, but humans start most wildfires in the U.S. (about 85%); lightning-caused fires burn a large share of the acreage because they start in remote places. Among thunderstorm hazards, flooding and lightning are the top killers.
Precipitation from severe storms
How precipitation forms
Cloud droplets form when air is cooled to saturation and water vapor condenses on cloud condensation nuclei (dust, salt, sulfate and smoke particles). A pure droplet would need large supersaturation to survive, because the curved surface of a tiny drop evaporates easily (the curvature or Kelvin effect); nuclei, especially soluble ones like salt, overcome that. Condensation alone, however, grows droplets far too slowly to make rain in the half hour a shower takes. A typical cloud droplet is about 0.01–0.02 mm across and falls about 1 cm/s, so any updraft keeps it aloft; a typical raindrop is about 2 mm across (100 times wider, a million times the volume) and falls about 6–7 m/s. Two processes bridge the gap:
- Collision-coalescence dominates in warm clouds (above freezing throughout, typical of the tropics, and of clouds with tops warmer than about −15 °C / 5 °F). Larger droplets fall faster than small ones, collide with them and merge (coalesce). The deeper the cloud and the stronger the updraft, the more collisions, so tall tropical cumulus can rain heavily without any ice.
- The Bergeron (ice-crystal or Wegener-Bergeron-Findeisen) process dominates in cold clouds (mid-latitudes, and the upper parts of all thunderstorms). Liquid water can stay supercooled down to about −40 °C, so between 0 and −40 °C ice crystals and supercooled droplets coexist. The saturation vapor pressure over ice is lower than over liquid water, so air that is just saturated for the droplets is supersaturated for the ice. Vapor leaves the droplets (they evaporate) and deposits on the crystals, which grow rapidly at the droplets' expense. It works best around −10 to −20 °C, where the difference is largest. Snow is the "runaway" product of the Bergeron process.
- Why droplets supercool. Pure water does not freeze at 0 °C on its own: freezing has to start on something. Tiny pure droplets freeze spontaneously (homogeneous freezing) only near −40 °C. Above that they freeze only with help from an ice nucleus, a rare particle (certain clay and mineral dusts, some bacteria, silver iodide used in cloud seeding) whose surface mimics the ice lattice (heterogeneous freezing), and most become active only below about −10 to −15 °C. Ice nuclei are far scarcer than condensation nuclei (roughly one per liter of air versus hundreds per cubic centimeter), so between 0 and −40 °C most cloud droplets stay supercooled liquid, which is what makes the Bergeron process, riming, hail and aircraft icing possible. (Structural icing on an aircraft needs visible moisture, cloud or precipitation, at temperatures at or below freezing.)
- Riming (accretion) is supercooled droplets freezing on contact with falling ice. Light riming coats a snowflake; heavy riming turns it into graupel, and continued accretion in a thunderstorm updraft builds hail.
- Aggregation is ice crystals sticking together into large snowflakes, most effective near 0 °C, where crystal surfaces are wet and sticky. Big, fluffy flakes mean temperatures near freezing.
Snow crystal shape depends on the temperature where it grows: plates near −2 °C, needles and columns near −5 °C, plates again near −10 °C, and the classic six-armed dendrites in the dendritic growth zone around −12 to −18 °C, which makes fluffy, high-ratio snow. A deep dendritic growth zone inside a strong lift zone means heavy snow.
Melting and evaporation cool the air. Both absorb latent heat. Snow melting as it falls cools the layer it falls through (which can lower the snow level during heavy precipitation), and rain evaporating below cloud base can chill the air by many degrees, which is the engine of downbursts. Snow can reach the ground with surface temperatures slightly above 0 °C (up to about 2–4 °C when the air is dry) because the warm layer is too shallow to melt the flakes and sublimation and melting chill the air.
Raindrop shape. Small drops (under about 1 mm) are spheres. Larger drops are flattened on the bottom by air resistance into a hamburger-bun shape; above about 5–6 mm they become unstable and break apart, which caps raindrop size. Never draw a raindrop as a teardrop. (This flattening is what dual-polarization radar measures; see Dual-polarization products.)
Precipitation types
| Type | Description | Size | How it forms |
|---|---|---|---|
| Drizzle | Fine, closely spaced drops that seem to float | under 0.5 mm | Collision-coalescence in shallow stratus or fog |
| Rain | Liquid drops | 0.5 mm or more (most 1–3 mm; at most about 6 mm) | Melted snow (Bergeron) or collision-coalescence |
| Freezing drizzle / freezing rain | Supercooled liquid that freezes on contact into glaze | drizzle < 0.5 mm; rain ≥ 0.5 mm | Liquid falls through a shallow sub-freezing surface layer and onto sub-freezing objects |
| Snow | Ice crystals and aggregates (plates, needles, columns, dendrites) | flakes up to several cm | Bergeron process and aggregation; stays below freezing to the ground |
| Snow grains | Very small, flat, opaque white grains; the solid counterpart of drizzle | under 1 mm | From stratus or fog, not convective |
| Ice crystals ("diamond dust") | Tiny glittering crystals in clear, very cold air | tiny | Deposition in extremely cold, calm air |
| Graupel (snow pellets, soft hail) | Soft, white, opaque, crushable pellets that bounce and break | about 2–5 mm | Heavy riming of snow crystals in convective clouds |
| Sleet (ice pellets) | Hard, clear or translucent pellets that bounce | up to 5 mm | Snow melts in a warm layer aloft, then the drops refreeze in a deep sub-freezing layer near the ground |
| Hail | Hard balls or lumps of ice, often with concentric layers | 5 mm or larger | Accretion of supercooled water on an embryo carried in a strong thunderstorm updraft |
| Virga | Streaks of rain or snow that evaporate before reaching the ground | — | Falls into dry air below a high cloud base |
Graupel itself comes in two common names, snow pellets and soft hail, and the old WMO term small hail (ice-coated graupel); METAR codes snow pellets GS and hail GR (in U.S. METARs since 2018, GR covers all hail, with the size in the remarks; under WMO practice, small hail under 5 mm is coded GS). The "four most common" precipitation types in elementary questions are rain, snow, sleet and hail. Note that "sleet" in British usage means a mix of rain and snow; tests use the U.S. meaning, ice pellets.
What reaches the ground: temperature layers
What falls out of a cold cloud is almost always snow at first. What reaches the ground depends on the temperature layers between cloud and ground, read from a sounding or a Skew-T:
| Profile from cloud to ground | Result |
|---|---|
| Below freezing all the way down (e.g. below 0 °C from the surface to 500 hPa) | Snow |
| A shallow or weak warm layer aloft partly melts the snow, then a deep sub-freezing layer near the ground refreezes it | Sleet (ice pellets) |
| A deep, warm layer aloft (a "warm nose", often above 2–3 °C) melts the snow completely, and only a shallow sub-freezing layer sits at the surface | Freezing rain: supercooled drops that freeze on contact |
| Shallow, warm-topped cloud with fine drops and a sub-freezing surface | Freezing drizzle |
| Above freezing deep enough near the ground to melt everything | Rain |
| Melting layer and surface near 0 °C | Wet snow, or a rain-snow mix |

Ahead of a warm front, these layers line up in bands: snow farthest into the cold air, then sleet, then freezing rain closer to the front, then rain in the warm sector. So sleet typically falls north of a warm front (in the U.S.), and ice pellets are the freezing type most often mixed with snow. Ice storms, blizzards and nor'easters are covered in Severe winter storms.
Hail
Hail is precipitation in the form of balls or irregular lumps of ice 5 mm (0.2 in) or more in diameter, always produced by convective clouds (cumulonimbus). Hail needs three things:
- A strong updraft to hold growing stones aloft: roughly 10 m/s (about 20 mph) for pea-size hail, about 29 m/s (about 65 mph) for golf-ball hail and 45 m/s (100 mph) or more for softball hail.
- Plenty of supercooled liquid water in the cloud, mostly between about −10 and −30 °C, for the stones to collect.
- Embryos: graupel or frozen drops to grow on.
How a hailstone grows. An embryo carried up in the updraft collects supercooled droplets that freeze on it (accretion). Updrafts vary in strength, so the stone rises, sinks a little, is caught again, and spends a long time in the growth zone, often moving around the edge of the main updraft (the BWER on radar) rather than bouncing simply up and down. Cutting a hailstone shows its history:
- Wet growth (clear ice): where liquid water is abundant and temperatures are not far below freezing, the latent heat released by freezing keeps the surface wet, so water spreads and freezes slowly, air bubbles escape and the ice is clear.
- Dry growth (milky or white ice): where it is colder or water is scarcer, droplets freeze instantly on contact, trapping air bubbles, so the ice is opaque white.
The stone falls when it becomes too heavy for the updraft to support or drifts out of the updraft. Hail size therefore tracks updraft strength, but a stronger updraft is not always better: an updraft that is too fast carries embryos through the growth zone too quickly and blows them into the anvil before they grow. The biggest stones come from supercells whose broad, rotating updrafts keep stones in the growth zone for a long time. Hail is rare in hurricanes because their updrafts are weaker and their clouds hold less supercooled water.
Hail size is reported by comparison with familiar objects:
| Object | Diameter (in) | Notes |
|---|---|---|
| Pea | 0.25 | |
| Marble or mothball | 0.50 | |
| Penny | 0.75 | Former severe threshold (before 2010) |
| Nickel | 0.88 | |
| Quarter | 1.00 | Severe threshold |
| Half dollar | 1.25 | |
| Ping-pong ball or walnut | 1.50 | |
| Golf ball | 1.75 | |
| Hen egg | 2.00 | "Significant" (very large) hail is 2 in or more |
| Tennis ball | 2.50 | |
| Baseball | 2.75 | |
| Tea cup | 3.00 | |
| Grapefruit | 4.00 | |
| Softball | 4.50 | Some charts list softball as 4.00 |
Fall speed. Bigger stones fall much faster, and the energy of impact grows roughly with the fourth power of the diameter (mass grows as , and the square of the fall speed roughly as ), so doubling the diameter multiplies impact energy about sixteen times. Approximate fall speeds: a 1 cm stone about 9 m/s (20 mph); quarter to golf-ball hail about 25–40 mph; 2–4 in hail about 45–70 mph; the largest stones can exceed 100 mph.
Where hail falls. Hail is most frequent on the High Plains, in "Hail Alley" where Colorado, Nebraska and Wyoming meet. Cheyenne, Wyoming, averages about 9–10 hail days a year, the most of any North American city. The reasons: high ground puts the freezing level closer to the cloud base, so stones melt less on the way down; and steep lapse rates (from elevated mixed layers) give strong updrafts. Texas and Colorado often lead the nation in hail damage (Colorado in losses per capita); the Denver area has had some of the costliest hailstorms. Along the ground, a storm lays down hail in a long band called a hail streak (or hail swath), typically 2–10 km wide and up to tens of kilometers long.
Records. The U.S. record hailstone fell at Vivian, South Dakota, on July 23, 2010: 8.0 in in diameter, 18.62 in in circumference and 1.94 lb. The previous record, from Aurora, Nebraska (June 22, 2003), was 7.0 in across but still holds the record circumference of about 18.75 in. The heaviest hailstone on record, about 1 kg (2.25 lb), fell in Bangladesh in 1986.
Hail damage. Large hail breaks roofs, windows and windshields, dents cars, injures people and livestock, strips crops (a few minutes can destroy a season's harvest) and damages aircraft in flight. Hail causes more than a billion dollars of insured damage in the U.S. in a typical year, more than tornadoes in many years. Hail suppression by cloud seeding (adding many artificial ice nuclei such as silver iodide) tries to create so many embryos that they compete for the limited supercooled water, so none grows large; its effectiveness is debated.
Floods, debris flows and mudslides
Flooding is the most common natural disaster in the United States and, over the long term, one of the deadliest: floods kill more Americans in an average year than tornadoes or lightning, and flash flooding is the leading cause of thunderstorm-related deaths. The rules separate several kinds:
| Flood type | Cause | Timing | Notes |
|---|---|---|---|
| Flash flood | Very heavy rain in a short time from slow-moving, training or back-building storms or tropical-cyclone rain; also dam or levee failure, ice-jam release | Within about 6 hours of the rain (often minutes in canyons, on steep slopes or in cities) | Fast, deep water carrying debris; most deadly |
| Urban (pluvial) flood | Rain on impervious surfaces (pavement, roofs) runs off instead of soaking in and overwhelms storm drains | Minutes to hours | Fills underpasses, low streets, basements; "pluvial" means flooding from rain itself, where drainage fails, away from rivers |
| River (stream, fluvial) flood | Prolonged rain or snowmelt across a whole watershed fills the channel and overflows its banks | Days to weeks; the crest moves downstream and can be forecast | Large rivers (e.g. the Mississippi in 1993) flood slowly over huge areas; spring freshets come from snowmelt |
| Coastal flood | Storm surge from hurricanes and nor'easters, plus high tides and waves | Hours | Covered in Storm surge |
| Debris flow | A fast slurry of water, soil, rock and trees racing down steep channels, entraining objects and leaving thick muddy deposits | Minutes after intense rain | Especially on burn scars |
| Mudslide / landslide | Saturated soil and rock on a steep slope losing strength and sliding; "mudslide" is the popular name for a fast, wet earth flow | During or after heavy or prolonged rain | Main cause: intense rainfall on steep, saturated ground |
| Glacial outburst (jökulhlaup) and lahar | Sudden release of glacier-dammed water; a volcanic mudflow (ash and water) | Sudden | Lahars are flash-flood-like but made of volcanic debris |
Runoff: intensity versus infiltration. Whether rain floods depends on how fast the ground can absorb it. The infiltration capacity is the maximum rate (e.g. in mm/h) at which soil can soak up water; it is high for dry, sandy, vegetated soil and low for clay, frozen, compacted, already saturated or paved ground. When rainfall intensity exceeds infiltration capacity, the excess becomes surface runoff (overland flow) that reaches streams in minutes. When the soil fills up completely, even light rain runs off. That is why:
- An inch of rain in 30 minutes floods; an inch over 24 hours mostly soaks in. Drought-stricken land benefits more from long, gentle rain than from a downpour, and hard, dry soil can even shed the first heavy rain.
- Impervious surfaces (cities) have near-zero infiltration, so urban runoff is fast and large. Paving grassy areas to "control" floods makes flooding worse; wetlands, green space and retention ponds reduce it.
- Wildfire burn scars flood and slide: fire removes the vegetation and the organic layer that holds and absorbs water, and can leave a water-repellent (hydrophobic) layer in the soil, so rain runs off rapidly, picks up ash and loose soil, and turns into debris flows, often in the first rainy season after the fire.
Streams, gauges and hydrographs. River levels are measured at stream gauges as stage (water height) and discharge (volume per second). Flood stage is the level at which water starts to affect people and property. A hydrograph plots discharge against time at one point: the stream rises after rain, reaches a peak, then falls back on the recession limb. The lag time between the center of the rain and the peak is short (minutes to a few hours) for small, steep, urban basins and long (days) for big rivers. Urbanization makes hydrographs taller and earlier. High precipitable water (the total water vapor in the column) and slow storm motion are the forecaster's flash-flood ingredients.
Training and back-building. Training echoes are cells moving one after another along the same path, like cars of a train, each dropping heavy rain on the same spot. Back-building happens when new cells keep forming on the upwind (back) side of a cluster, so the system stays nearly stationary even though each cell moves on. Both are signatures of flash-flood setups, as in the September 2013 Colorado Front Range floods, when a stalled moist upslope flow produced storms over the same area for days.
Impacts of heavy precipitation
- Structures: heavy wet snow can collapse roofs (snow load is about the weight, not the depth: wet snow can weigh several times more than the same depth of powder). Ice accretion from freezing rain snaps tree limbs and power lines; a quarter inch of ice causes outages and half an inch major damage. Floodwater undermines foundations, roads and bridges, overtops or breaches dams and levees (the failure of New Orleans' levees and floodwalls caused most of the drowning deaths in Hurricane Katrina), contaminates water supplies and leaves mold. Hail breaks roofs and windows.
- Travel: most flood deaths happen in vehicles: more than half of flood drownings involve vehicles, because 6 inches of moving water can knock a person down, about 12 inches can carry away most cars and 2 feet can carry away SUVs and trucks ("Turn Around, Don't Drown"). Air travel is disrupted by low ceilings, icing, hail and runway closures; ground travel by flooded roads, washed-out bridges, glaze ice and whiteouts. Freezing rain makes sidewalks and roads glassy and is especially dangerous because the glaze can be nearly invisible ("black ice").
- Indirect effects: debris flows and mudslides bury roads and homes; floods spread disease and destroy crops; long power outages from ice storms lead to cold exposure and carbon-monoxide poisoning.
State & National only: IDF curves and return periods
An intensity-duration-frequency (IDF) curve shows how much rain (as an intensity in in/h or mm/h, or as a depth) falls in a given duration for a given return period (frequency) at one place. Each curve is one return period; intensity drops as duration grows, because short bursts are always heavier than a long-duration average, and the curves for rarer events sit higher. NOAA publishes these values (NOAA Atlas 14 and its successor) and engineers use them to derive design storms and to size culverts, storm drains, detention ponds and dams. Reading one tells you how rare a given storm was: find its duration on the x-axis and its intensity on the y-axis, and see which return-period curve it falls on.
A return period (recurrence interval) is the average time between events of a given size. A "100-year rain" is not one that happens once a century: it has a 1% chance of happening in any given year, and it can happen in consecutive years.
The empirical IDF equation. IDF curves for a place are often fitted with an equation of the form
The numerator makes rarer storms (larger ) more intense; the denominator makes longer durations less intense. The constants are different for every location.
Damaging winds
Most severe-weather reports are wind, not tornadoes, and straight-line winds can do damage equal to an EF1–EF2 tornado over a much larger area. The rules list these wind types.
Downdrafts, downbursts and microbursts
Downdrafts are sinking air in a thunderstorm. Three things make the air sink:
- Precipitation loading (drag): rain and hail drag the air down with them.
- Evaporative cooling: rain falling into drier air evaporates, absorbing latent heat; the chilled air is denser than its surroundings and accelerates downward. This is the biggest effect, and it is strongest where there is dry air below or around the storm.
- Melting of hail and graupel, and sublimation of snow, absorb more heat.
A downburst is a strong downdraft that hits the ground and spreads out in all directions, producing damaging straight-line winds. Ted Fujita identified downbursts after studying the 1974 Super Outbreak damage and the 1975 Eastern Airlines Flight 66 crash at New York's JFK airport, and split them by size:
| Feature | Microburst | Macroburst |
|---|---|---|
| Outflow size | less than 4 km (2.5 mi) across | 4 km (2.5 mi) or more |
| Duration of damaging winds | Typically 2–5 minutes (whole event about 5–15 minutes) | 5 to 30 minutes |
| Peak winds | Commonly 60–100+ mph; NWS spotter material cites up to about 168 mph; the highest measured is 149.5 mph (Andrews Air Force Base, Maryland, 1983) | Up to about 130 mph |
| Danger | Concentrated, sudden wind shear; deadly to aircraft | Wider swaths of damage like a weak tornado |
- Wet microbursts come with heavy rain reaching the ground; common in the humid Southeast and the Plains in summer. The rain shaft often has a curling "foot" at its base where the outflow spreads.
- Dry microbursts fall from high-based storms over a deep, dry, well-mixed layer (common over the High Plains and the desert West); often only virga is visible, perhaps with a ring of blowing dust. The virga's evaporation is what chills and accelerates the air, so virga is a warning sign of microbursts.
- Aviation: a plane flying through a microburst on approach first meets a headwind (extra lift), then a downdraft, then a sudden tailwind that robs it of lift near the ground. Microbursts caused several crashes, including Delta Flight 191 at Dallas–Fort Worth (1985); airports now use Terminal Doppler Weather Radar and Low-Level Wind Shear Alert Systems, and pilots train to recognize the signs.

Heat bursts are rare dry downbursts, mostly at night on the Plains, from a dying thunderstorm over very dry air. The downdraft sinks so far below where evaporation can keep it cool that it warms by compression at the dry adiabatic rate and reaches the ground hotter and drier than the air it replaces: temperatures can jump 10–20 °F or more in minutes, with damaging gusts.
Gust fronts, outflow boundaries and haboobs
A gust front is the leading edge of a storm's rain-cooled outflow spreading along the ground, a miniature cold front. Passing it brings a wind shift and a strong gust, a temperature drop, a pressure jump (a "mesohigh" under the storm), and often a shelf cloud, all before the rain. Gust fronts can travel tens of kilometers ahead of the storm. When the storm dies, its outflow boundary can persist for hours and trigger new storms the next afternoon where it lifts warm, moist air (see Fronts and drylines). In multicells and squall lines, new cells form continually along the gust front.
Two phenomena on gust fronts are often confused with tornadoes:
- A gustnado is a brief, shallow whirl of dust or debris along the gust front, usually with no condensation funnel and not connected to the cloud above; it can cause minor damage but is generally not counted as a tornado.
- A haboob (from the Arabic for "blowing") is a wall of dust or sand pushed ahead of a thunderstorm's gust front (or a downburst) over dry, loose ground. It can be thousands of feet tall and tens of miles wide, drops visibility to near zero in seconds and causes highway pileups. Haboobs are common in Sudan and the Sahara, the Middle East, and in Arizona (Phoenix) during the summer monsoon (July–September), when storms over the mountains send outflows across the desert. Deserts are prone to them because of loose, dry soil, intense heating that creates deep, dry, well-mixed air (ideal for evaporatively driven downbursts), and monsoon moisture that triggers the storms. The NWS issues dust storm warnings for them.
Squall lines and derechos
A squall line is a line or band of thunderstorms (see Storm types: single cell to supercell), often with a narrow band of strong wind at its leading edge. Straight-line winds, heavy rain, and sometimes hail and brief tornadoes are its hazards; heavy rain is its typical precipitation hazard.
A derecho (Spanish for "straight", a term coined by Gustavus Hinrichs in 1888 as the counterpart of "tornado") is a widespread, long-lived, straight-line windstorm produced by a fast-moving line or cluster of storms (an MCS). It consists of many downbursts, downburst clusters and bow echoes in a family, moving at 50 mph or more.
- Classic definition (Johns and Hirt, 1987; still on the SPC's derecho facts page): a swath of convective wind damage at least 250 miles (400 km) long, with gusts of at least 58 mph along most of its length and several well-separated gusts of 75 mph or more.
- Revised definition (Corfidi and others, 2016): a swath at least about 400 miles (650 km) long and 60 miles (100 km) wide, with gusts of 58 mph or more along most of it and several of 75 mph or more, produced by an MCS with a bow echo (rear-inflow jet). Tests from the last few seasons use both numbers; follow the test's own definition when it gives one.
| Derecho type | Structure | Season |
|---|---|---|
| Progressive | A single, relatively short bow echo (about 40–250 mi long) that races along a path nearly parallel to a stationary front, often for hundreds of miles, near the northern edge of hot, humid air | Mostly summer (warm season, May–August) |
| Serial | A long squall line (often hundreds of miles) with several bow echoes and embedded supercells moving along it, ahead of a strong low | Spring and fall (sometimes winter) |
| Hybrid | Features of both | — |
In the U.S. derechos are most common in the warm season, May to August: roughly 70% of derechos (a commonly quoted figure) fall in those four months, and the SPC's derecho facts page says more than 75% occur between April and August. The two numbers agree; the second simply adds April. Cool-season (September–April) derechos are less frequent and are usually the serial type. They occur in two corridors: from the upper Midwest and Great Lakes to the Ohio Valley (the "corn belt" in summer), and from the southern Plains northeast into the mid-Mississippi Valley. Famous examples include the June 29, 2012 derecho (Chicago area to the Mid-Atlantic coast, millions without power) and the August 10, 2020 Midwest derecho, with gusts up to about 140 mph in Iowa.
Derechos outside the U.S. They occur wherever warm, moist, unstable air and strong winds aloft meet: in Canada (Ontario and Quebec, such as the May 21, 2022 derecho), across Europe (Germany in July 2002, Finland, France, Spain, Bulgaria, Poland and Italy), in Russia, and in Bangladesh and eastern India, where some spring "nor'westers" (kalbaishakhi) are progressive derechos. They are also expected in parts of South America, Africa and Australia where similar conditions occur.
Downslope and mountain winds
Downslope winds form when strong flow crosses a mountain range and air descends the lee slope, warming by compression at the dry adiabatic rate (about 10 °C per km). If the air lost moisture on the windward side, it arrives warmer and much drier than it started (the foehn effect, explained in Terrain).
| Wind | Where | Type | Notes |
|---|---|---|---|
| Chinook ("snow eater") | East slopes of the Rockies, especially late winter | Warm, dry downslope (foehn) | Can raise temperatures 20–40 °F in minutes and melt snow fast; Boulder, Colorado, windstorms gust past 100 mph |
| Foehn | Alps (the original name); general term | Warm, dry downslope | "Chinook" is the North American name for a foehn |
| Santa Ana | Southern California, fall and winter | Warm, very dry, gusty offshore downslope wind | Driven by high pressure over the Great Basin (Nevada, Utah); the air warms by compression as it descends to the coast, through passes and canyons; spreads wildfires |
| Katabatic (gravity, drainage) | Ice sheets (Antarctica, Greenland), high plateaus, snowfields; the bora of the Adriatic | Cold, dense air flowing downhill under gravity | Formed when the slope surface is colder than the air beside it; still cold on arrival despite compressional warming; can be extremely strong off ice sheets |
Reading wind damage
Damage surveyors tell straight-line wind from tornadoes by the pattern:
- Downburst / straight-line damage is divergent: trees and debris lie in one direction or fan outward from the point of impact (a "starburst"), with no debris thrown back toward the center.
- Tornado damage is convergent and rotational: debris points inward toward a narrow damage path, often in swirls or criss-crossed patterns, with debris thrown in multiple directions and lofted.

Scale terms: tornadoes and microbursts are microscale (under about 2 km); squall lines, MCSs, supercells and sea breezes are mesoscale; jet streams, mid-latitude cyclones and the global circulation are synoptic to global scale.
Wind signatures on radar
- Bow echo. A line segment that bows outward, pushed by a strong rear-inflow jet. The worst winds are at the apex (center) of the bow; a rear-inflow notch (a weak-echo notch behind the line) marks where the jet descends. Bookend vortices at the ends can spin up brief tornadoes, especially on the northern end, which often grows a rotating comma head. Most bow-echo damage is from straight-line winds, not tornadoes. A derecho appears as one large bow or a series of bows.
- Gust fronts appear on reflectivity as a thin line of weak echo (a fine line) ahead of the storms, because insects and dust are swept up along the boundary; on velocity they show as a sharp wind shift.
- Squall lines and derechos show as long lines or a series of bow echoes, often with trailing stratiform rain behind; velocity shows a broad band of strong inbound or outbound winds (often 50 kt or more) just above the ground.
- Downbursts show on velocity as divergence near the ground: inbound and outbound velocities side by side along a radial (one toward and one away from the radar), unlike the side-by-side couplet across the radial of rotation. A descending reflectivity core aloft often precedes them.

Tornadoes and waterspouts
A tornado is a violently rotating column of air in contact with the ground and pendant from (or beneath) a cumuliform cloud, usually a cumulonimbus. The visible funnel is condensation (cloud droplets) plus lofted dust and debris; the circulation can reach the ground before the funnel does, and some tornadoes are invisible or wrapped in rain. A funnel cloud is a rotating funnel that has not reached the ground. A waterspout is a tornado over water.
How tornadoes form
The ingredients. High instability (CAPE), strong deep-layer shear (for supercells), strong low-level shear (large storm-relative helicity, a clockwise-curved hodograph in the lowest kilometer), a low cloud base (low LCL, meaning humid low levels; outflow is not too cold), and a trigger such as a dryline, front, warm front or outflow boundary. On the Plains, the classic setup is warm, moist Gulf air at the surface under dry air from the desert Southwest, with cold, dry air behind a front from Canada and a strong jet stream overhead: the clash of air masses over flat land is why the U.S. has more tornadoes than anywhere else.
Supercell tornadogenesis (a simplified sequence):
- Wind shear creates horizontal vorticity near the ground; the supercell updraft tilts and stretches it into a mesocyclone a few kilometers wide at mid-levels.
- The rear-flank downdraft (RFD) descends on the back side and wraps around the mesocyclone. It carries rotation generated along its temperature contrasts down to the ground and brings that spin under the updraft.
- The intense updraft stretches the near-ground rotation vertically. Like a figure skater pulling in her arms, the column narrows and spins much faster (conservation of angular momentum). A low-level mesocyclone and wall cloud form, and the clear slot wraps around.
- The tornado forms near the boundary between the RFD and the updraft, typically on the storm's southwest (right-rear) flank, at the tip of the hook echo.
Most supercells and most mesocyclones never produce a tornado. Cool, too-cold RFDs, weak low-level shear or high cloud bases tend to prevent one; forecasting which storm will produce a tornado remains one of the hardest problems in meteorology.
Pressure and wind in the core. Air spins so fast around the core that the pressure-gradient force balances the centrifugal force (cyclostrophic balance; Coriolis is negligible at this scale, so tornadoes can spin either way, though more than 95% of Northern Hemisphere tornadoes are cyclonic, counterclockwise). The core pressure is far lower than outside: a probe placed in a violent tornado at Manchester, South Dakota (2003) measured a drop of about 100 hPa (3 inHg) in seconds. The low pressure, cooling the air as it expands, is why the condensation funnel forms. Damage, however, comes overwhelmingly from the wind and flying debris, not from the pressure drop: houses are not "exploded" by low pressure, and opening windows does nothing except waste time. High wind flowing over a roof does lower the pressure above it and helps lift it off.
Non-supercell tornadoes.
- Landspouts form when a growing cumulus or cumulonimbus updraft stretches a pre-existing spin near the ground (along a boundary or convergence line), without a mesocyclone. They look like fair-weather waterspouts over land: thin, smooth, rope-like; usually weak (EF0–EF1) and short-lived. They are tornadoes (non-supercell type).
- Gustnadoes (see above) are gust-front whirls usually not connected to the cloud base; generally not tornadoes.
- Tornadoes in squall lines and bow echoes (quasi-linear convective systems) form along the leading edge and in bookend vortices; often brief, rain-wrapped and hard to warn for.
- Tropical-cyclone tornadoes form in the outer rainbands, mostly in the right-front quadrant of a landfalling hurricane; usually weak and brief.
- Dust devils are not tornadoes: they form under clear skies on hot, sunny, calm days over dry ground, when intense surface heating creates a rotating thermal; they are not connected to a cloud, are usually a few meters to tens of meters wide and are no stronger than the weakest tornadoes. Fire whirls (from wildfires) are similar. Like tornadoes, they are in cyclostrophic balance and can spin either way.
Tornado life cycle
The NWS spotter guides describe a five-stage life cycle:
| Stage | What you see |
|---|---|
| 1. Dust-whirl stage | Dust or debris swirls up from the ground beneath a short funnel pendant from the cloud base; the funnel has not reached the ground but the tornado already has, and damage can occur |
| 2. Organizing stage | The funnel descends and the tornado strengthens and widens |
| 3. Mature stage | Widest and strongest; the funnel is often nearly vertical and may reach the ground; most damage occurs now |
| 4. Shrinking stage | The funnel narrows and tilts as cold RFD air wraps around it and cuts off the warm inflow; the damage path narrows, but winds can still be intense |
| 5. Decaying (rope) stage | The vortex stretches into a thin, twisted, contorted rope and breaks up; still capable of damage until it fully dissipates |
Shorter versions (organizing → mature → shrinking → decaying, or formation → maturity → dissipation) are also accepted. The parent supercell may then form a new mesocyclone and tornado nearby (cyclic tornadogenesis), so one storm can leave a "family" of separate tornado tracks along its path.
Shape and structure. Tornadoes are described as rope (thin, sinuous), cone or funnel, stovepipe (straight-sided column), or wedge (as wide as or wider than it is tall, usually a large, intense tornado). A multiple-vortex tornado contains two or more small suction (subsidiary) vortices orbiting the main circulation; each adds its spin to the parent's, which explains narrow streaks of extreme damage next to lighter damage. A satellite tornado is a separate tornado orbiting a larger one.

Tornado statistics and records
| Quantity | Typical value | Extremes |
|---|---|---|
| Duration | Most last under 10 minutes (often 5–10 min) | Over an hour for long-track violent tornadoes; the Tri-State tornado lasted about 3.5 hours |
| Width | About 50–500 yards; U.S. average about 150 m (500 ft) | El Reno, Oklahoma, May 31, 2013: 2.6 mi (4.2 km), the widest on record |
| Path length | A few miles (U.S. average about 5 mi) | Tri-State tornado, March 18, 1925: 219 mi in Missouri, Illinois and Indiana (a later study found at least 174 mi from one continuous tornado) |
| Forward speed | About 30 mph; from nearly stationary to 70 mph | Tri-State moved about 60–73 mph; you cannot reliably outrun a tornado in a car on congested roads |
| Wind speed | Most under 110 mph | Mobile Doppler radar measured about 300 mph (just above ground) in the 1999 Bridge Creek–Moore, Oklahoma, F5 tornado |
| Intensity mix | About 75–80% are EF0–EF1 ("weak"), about 20% EF2–EF3 ("strong") | EF4–EF5 ("violent") are about 1–2% but cause roughly two-thirds of tornado deaths |
| Deadliest (U.S.) | — | Tri-State tornado, 1925: 695 deaths |
| Deadliest (modern U.S.) | — | Joplin, Missouri, May 22, 2011: EF5, 158 direct deaths (161 total), about $2.8 billion |
| Deadliest (world) | — | Daulatpur–Saturia, Bangladesh, April 26, 1989: about 1,300 deaths |
Where and when.
- The United States has more tornadoes than any other country (about 1,200 a year), because warm, moist air from the Gulf of Mexico meets cool, dry air from Canada and hot, dry air from the desert Southwest and the Rockies over flat land with a strong jet stream overhead. Canada is second (about 60–100 a year). Bangladesh has the deadliest record because of dense population and weak housing.
- Tornado Alley in the southern and central Great Plains (Texas, Oklahoma, Kansas, Nebraska, into South Dakota) peaks in May and June. Dixie Alley in the Southeast (Mississippi, Alabama, Tennessee, Arkansas, Louisiana, Georgia) has more tornadoes in early spring and late fall (and even winter), more at night, faster storm motion, more mobile homes, and more tornadoes hidden by rain, hills and trees, so its tornadoes are deadlier. Recent decades show activity shifting east toward the Mid-South.
- Season: May has the most tornadoes nationally; the peak moves from the Gulf Coast in early spring to the southern Plains in May and the northern Plains and Upper Midwest in June–July.
- Time of day: most occur between about 3 and 9 p.m. local time, when instability peaks; night tornadoes are far deadlier because people do not see or hear the warnings.
- Track direction: most move from southwest to northeast, steered by the mid-level westerlies; tornadoes from northwest-flow or hurricane situations can move in other directions.
- Florida has a high number of tornadoes for its size (high frequency per square mile) because of daily thunderstorms, waterspouts moving ashore and hurricane rainbands, but most are weak; it also logs tornadoes in winter from strong cold-season systems.
- Terrain matters less than once believed: tornadoes cross rivers, hills and cities. Rougher terrain and forests can disrupt weaker tornadoes, and along a path, damage ratings rise and fall as the tornado meets different targets and strengthens or weakens.
Waterspouts
| Type | How it forms | Strength | Where and when |
|---|---|---|---|
| Fair-weather waterspout | Forms from the water surface up under a line of growing cumulus or cumulus congestus in light winds; no mesocyclone (like a landspout over water) | Usually weak (EF0); short-lived (minutes) | Warm tropical and subtropical waters: the Florida Keys (the most active area in the U.S., hundreds a year), the Gulf of Mexico, the Mediterranean and Adriatic; also the Great Lakes in late summer and fall when cold air crosses warm water |
| Tornadic waterspout | A true supercell or strong-storm tornado over water, or one that moves from land to water; forms from the cloud down | Can be strong | Wherever severe storms occur over water |
A fair-weather waterspout passes through its own five stages: a dark spot on the water, a spiral pattern of light and dark bands, a spray ring (the spray vortex), the mature vortex with a condensation funnel, and decay. Waterspouts (and strong updrafts) can lift fish and frogs from ponds and lakes and drop them miles away, the source of reports of "raining animals". Waterspouts that move ashore are counted as tornadoes. Cold northern waters with little convection (such as off Newfoundland) see few waterspouts.
F and EF scales
Tornadoes are rated after the event from damage, not from a direct wind measurement. Ted Fujita (University of Chicago) introduced the Fujita (F) scale in 1971, linking damage to estimated wind speeds; it was used in the United States until February 1, 2007, when the Enhanced Fujita (EF) scale replaced it (Canada adopted its own version in 2013). The EF scale was introduced because the F scale had serious weaknesses: it did not account for how well a building was constructed (a poorly built house and a well-engineered one doing the same "damage" got the same rating), it had few damage indicators, and engineering studies showed it overstated the winds needed for a given level of damage, especially at the top.
How the EF scale works:
- 28 damage indicators (DIs): types of structures and vegetation, for example one- or two-family residences (FR12), single-wide and double-wide manufactured homes, small barns or farm outbuildings (SBO), schools (elementary, junior or senior high: JHSH), high-rise buildings (HRB), transmission line towers (TLT), and hardwood and softwood trees.
- Each DI has a series of degrees of damage (DODs) from the first visible damage to total destruction, each with an expected wind speed and a lower and upper bound. For example, a one- or two-family home has ten DODs, from loss of a few shingles up to the slab swept clean.
- Surveyors rate many DIs along the path and assign the highest rating supported by the damage. The winds are 3-second gust estimates, not measurements. A rating can use measured winds from mobile radar only as supporting evidence.
There are six ratings, EF0 to EF5 (and the F scale also had six, F0 to F5). Fujita's theoretical F6 and above ("inconceivable", over 319 mph) was never assigned: no tornado has been rated F6.
| Rating | F scale (before Feb. 1, 2007), estimated wind | EF scale (from Feb. 1, 2007), estimated 3-second gust | Typical damage |
|---|---|---|---|
| 0 | 40–72 mph | 65–85 mph | Shingles and siding peeled, gutters and branches broken, shallow-rooted trees pushed over |
| 1 | 73–112 mph | 86–110 mph | Roofs badly stripped, mobile homes overturned, windows and doors lost, attached garages may be destroyed |
| 2 | 113–157 mph | 111–135 mph | Roofs torn off well-built houses, frame homes shifted on foundations, mobile homes destroyed, large trees snapped or uprooted, light objects become missiles, cars lifted |
| 3 | 158–206 mph | 136–165 mph | Entire stories of well-built houses destroyed, severe damage to large buildings such as malls, trains overturned, trees debarked, heavy cars thrown |
| 4 | 207–260 mph | 166–200 mph | Well-built houses leveled, cars thrown, small missiles generated |
| 5 | 261–318 mph | Over 200 mph | Strong frame houses leveled and swept from foundations; steel-reinforced concrete structures badly damaged; cars thrown more than 100 m; high-rise buildings with structural deformation |

Tornadoes on radar
Radar fundamentals (reflectivity, velocity, dual-pol) are in Doppler radar products; the full signature table is in Radar signatures of severe storms.

- Reflectivity: a hook echo on the right-rear flank of a supercell, where rain and hail wrap around the mesocyclone. A debris ball, a small round spot of high reflectivity at the tip of the hook, is lofted debris. An inflow notch and a BWER mark the strong updraft beside it.
- Velocity: a tight couplet of strong inbound and outbound velocities next to each other across the radar beam (one side toward the radar, the other away). A broad couplet is a mesocyclone; a small, intense one with gate-to-gate shear is a tornadic vortex signature (TVS), which shows strong rotation but does not prove a tornado is on the ground. Use storm-relative velocity (storm motion subtracted) to see rotation in a fast-moving storm, and always note where the radar is, because the beam only measures motion toward or away from it.
- Correlation coefficient: a small area of very low CC (below about 0.8) collocated with the couplet and hook is a tornado debris signature (TDS), near-confirmation that a tornado is on the ground and doing damage.
- Limits: the beam rises with distance (see How the beam travels), so far from the radar it overshoots the low-level rotation; tornado warnings therefore combine radar with spotter reports. A tornado warning is issued when a tornado is reported or radar shows rotation that is likely to produce one; a storm with only large hail and wind gets a severe thunderstorm warning (see Watches and warnings). Average lead time is roughly 8–13 minutes (see Warning criteria).
- A bow echo can also produce tornadoes, usually brief ones at the comma head or along the leading edge.

Hurricanes, typhoons and cyclones
A tropical cyclone is a rotating, organized system of thunderstorms with a closed low-level circulation that forms over tropical or subtropical water and has no fronts. The name changes with the ocean basin, not with the physics: the storm the U.S. calls a hurricane is the same kind of system as a western Pacific typhoon or an Indian Ocean cyclone.
Tropical cyclone engine: warm core and latent heat
Energy source. Warm ocean water evaporates into the air spiraling toward the center; the air gains sensible heat (direct warming from the sea) and much more latent heat (the energy stored in water vapor). When that air rises in the eyewall and rainbands, the vapor condenses and the latent heat is released, warming the core of the storm. Warm air is less dense, so a warm column has lower surface pressure under it; lower pressure draws in more air, which picks up more heat and moisture. As long as the ocean keeps supplying vapor, the loop sustains itself. (For latent heat itself, see Specific heat, sensible heat and latent heat.)
Warm core vs cold core. In a hurricane the center is warmer than the surroundings at the same height, with the largest warm anomaly in the upper troposphere above the eye. Because the core is warm, the low is strongest at the surface and weakens with height, turning into a high (anticyclone) with clockwise outflow near the tropopause. A mid-latitude cyclone is the opposite: a cold-core low that strengthens with height, tilts westward with altitude and gets its energy from horizontal temperature contrasts along fronts.
The full side-by-side comparison of tropical and mid-latitude cyclones is in Mid-latitude cyclones.
The heat engine idea. A mature hurricane works like a heat engine: it takes in heat at the warm sea surface (~300 K), converts part of it into the kinetic energy of the wind, and gives up the rest by radiation from the cold outflow at the tropopause (~200 K). The efficiency limit depends on that temperature difference, which is why warmer water and colder outflow allow a stronger storm (the storm's "maximum potential intensity").
How much energy? NOAA's Hurricane Research Division estimates that an average hurricane rains about 1.5 cm per day over a circle of radius 665 km.
Where and when tropical cyclones form
All of the following are needed together. Tests usually ask for a list, or ask which one is missing in a scenario.
| Condition | Why it matters | Typical value |
|---|---|---|
| Warm ocean | Supplies heat and vapor; the water must stay warm when the storm churns up cooler water below | ≥ 26.5 °C (80 °F) through ~50 m depth |
| Unstable atmosphere | Air must cool fast enough with height that saturated parcels stay buoyant and build deep thunderstorms | Conditionally unstable tropical sounding |
| Moist middle troposphere | Dry air at ~3–6 km evaporates cloud, makes cold downdrafts and chokes the storm (e.g., the Saharan Air Layer) | Relative humidity high near 5 km |
| Low vertical wind shear | Shear tilts the warm core and blows its heat and moisture away from the center | Less than ~10 m/s (20 kt) between ~850 and 200 hPa |
| Coriolis effect | Needed to turn inflow into a closed circulation; it is zero at the equator | At least ~5° latitude |
| Pre-existing disturbance | Low-level convergence and spin to start from | Tropical wave, old front, monsoon trough |
| Upper-level divergence | Removes the rising air aloft so surface pressure can fall | Outflow anticyclone over the storm |
Latitude band. Most tropical cyclones form between about 5° and 20° of latitude (a few to 30°). None form within about 5° of the equator because the Coriolis effect there is too weak to organize rotation, and no storm has ever crossed the equator. The South Atlantic and southeastern Pacific almost never get them: their water is cool (cold currents and upwelling), vertical shear is strong, and the ITCZ rarely moves south of the equator there. Cyclone Catarina (2004, off Brazil) was a rare exception.
Seeds. In the Atlantic about 60% of tropical storms and about 85% of major hurricanes grow from African easterly waves (tropical waves): troughs in the trade-wind easterlies that leave West Africa every 3–4 days in summer. Storms that form from them near the Cabo Verde Islands are called Cape Verde (Cabo Verde) storms and have the longest tracks over warm water. Early- and late-season Atlantic storms more often form in the Gulf of Mexico, the western Caribbean or off the Southeast coast, from old fronts or the Central American gyre.

| Basin | Local name | Official season | Peak | Warning center (WMO RSMC) |
|---|---|---|---|---|
| North Atlantic (incl. Gulf and Caribbean) | Hurricane | June 1 – Nov 30 | ~Sept 10 (Aug–Oct) | National Hurricane Center, Miami |
| Eastern North Pacific | Hurricane | May 15 – Nov 30 | Late Aug – early Sept | National Hurricane Center, Miami |
| Central North Pacific | Hurricane | June 1 – Nov 30 | Aug – Sept | Central Pacific Hurricane Center, Honolulu |
| Western North Pacific | Typhoon (super typhoon ≥ 130 kt, U.S. usage) | Year-round | Aug – Sept | Japan Meteorological Agency, Tokyo |
| North Indian (Bay of Bengal, Arabian Sea) | Cyclonic storm / cyclone | Year-round | May and Oct – Nov (either side of the monsoon) | India Meteorological Department, New Delhi |
| Southwest Indian | Tropical cyclone | Nov 15 – Apr 30 | Jan – Mar | Météo-France, La Réunion |
| Australian region and South Pacific | Tropical cyclone (severe tropical cyclone) | Nov 1 – Apr 30 | Feb – Mar | Bureau of Meteorology and Fiji (Nadi) |
The western North Pacific is the most active basin, producing about a third of the world's 80–90 tropical storms per year and the most intense storms. The North Atlantic averages (1991–2020) about 14 named storms, 7 hurricanes and 3 major hurricanes a year; September is the usual answer for the Atlantic peak month (peak about Sept 10); the eastern Pacific peaks a little earlier, in late August (into early September), per NHC climatology.
Eastern Pacific vs Atlantic. Per unit area the eastern North Pacific (off Mexico) is the busiest basin on Earth. Its 1991–2020 average is about 15 named storms, 8 hurricanes and 4 major hurricanes, slightly more than the Atlantic's 14, 7 and 3, packed into a much smaller area. Its season starts earlier (May 15) and its activity peaks in late August, less sharply than the Atlantic's Sept 10 peak. Very warm water off southern Mexico, low shear and a steady supply of tropical waves (many of them the same African easterly waves that crossed the Atlantic) let its storms intensify fast; Patricia (2015) is the strongest on record in the Western Hemisphere. But most eastern Pacific storms move west or northwest, away from land, over cold California Current water, where they die quickly, so few make landfall (mostly in Mexico, and rarely the U.S. Southwest, as Hilary did in 2023). Atlantic storms are fewer but often track toward the Caribbean islands and the U.S. coast over warm water and so are more likely to strike land.
The tropical upper-tropospheric trough (TUTT). In summer and early fall a semi-permanent upper-level trough (near 200 hPa) stretches across the subtropical North Atlantic and North Pacific, with embedded cold-core TUTT lows (upper lows that do not reach the surface). Its strong westerly winds aloft shear storms that lie under or west of it, a common reason tropical systems in the central Atlantic fail to develop. But a storm that sits southeast of a TUTT low can use its southwesterly flow as an extra outflow channel, which removes air aloft and helps it intensify; occasionally a TUTT low works down to the surface and seeds a tropical or subtropical storm.
ENSO shifts the odds: El Niño raises westerly shear over the Caribbean and tropical Atlantic and suppresses Atlantic hurricanes while boosting the central and eastern Pacific; La Niña does the reverse (see ENSO and ocean patterns).
Naming tropical cyclones
A storm gets a name when it becomes a tropical storm (34 kt, 39 mph). Names make warnings shorter and less confusing than latitude-longitude positions, especially when two storms are active at once.
- Atlantic: six alphabetical lists of 21 names used in rotation, so a list returns every six years (the 2025 list is reused in 2031). Q, U, X, Y and Z are skipped. Names alternate male and female (since 1979). The lists are maintained by the World Meteorological Organization's regional hurricane committee, not by the NHC alone.
- Retirement: a name is retired when a storm was so deadly or costly that reusing it would be insensitive, and is replaced by another name with the same letter. Retired examples include Andrew, Katrina, Sandy, Harvey, Maria, Ian, Ida and Helene.
- Running out of names: the Greek alphabet was used as a backup in 2005 and 2020. In 2021 the WMO discontinued Greek letters (they were confusing and drew attention to the letter rather than the hazard) and replaced them with a supplemental list of ordinary names.
- Eastern Pacific: six rotating lists of 24 names (no Q or U). Central Pacific: four lists of Hawaiian names used in sequence, not restarted each year. Western Pacific: a list of 140 names contributed by 14 countries (many are flowers, animals or places), assigned in order by the Japan Meteorological Agency; the Philippines also uses its own local names.
- Numbers come first: a disturbance being watched is an invest numbered 90–99 with a basin letter (e.g., 95L in the Atlantic); a tropical depression gets a number (e.g., "Tropical Depression Nine") and keeps it after it is named.
Life cycle
Every tropical cyclone begins as a tropical disturbance, so if a question asks for the first stage of development, answer tropical disturbance, then tropical depression, tropical storm and hurricane. Most Atlantic storms start as African easterly waves (see Where and when tropical cyclones form), which is why the tropical wave is listed with the disturbance below.
| Stage | Definition (1-minute sustained wind) |
|---|---|
| Tropical disturbance | An organized area of thunderstorms, roughly 200–600 km across, that keeps its identity for 24 hours or more; no closed circulation |
| Tropical wave (easterly wave), one common seed | An elongated trough in the trade-wind easterlies, marked by a wind shift and a band of showers; no closed circulation. Not a separate stage: a wave that organizes thunderstorms is a tropical disturbance (other disturbances grow from old fronts, upper lows or the monsoon trough) |
| Invest | A disturbance the National Hurricane Center has flagged for investigation and special model runs; not yet a cyclone |
| Potential tropical cyclone | A disturbance that is not yet a cyclone but is expected to bring tropical-storm or hurricane conditions to land within 48 hours, so NHC starts advisories and watches early (used since 2017) |
| Tropical depression | A closed circulation with organized storms; winds 38 mph (33 kt) or less |
| Tropical storm | 39–73 mph (34–63 kt); the storm gets a name |
| Hurricane | 74 mph (64 kt) or more |
| Major hurricane | Category 3 or higher: 111 mph (96 kt) or more |
The storm then dissipates over land or cold water, or becomes post-tropical or extratropical as it moves into the mid-latitudes and takes on fronts. An extratropical storm can still be enormous and dangerous, as Sandy showed. Post-tropical is NHC's umbrella term for any former tropical cyclone that no longer qualifies (extratropical or a remnant low without organized thunderstorms). A subtropical cyclone is a hybrid with a broader, lopsided wind field and a partly cold core, common early or late in the season.
Formation needs and timing are covered in Where and when tropical cyclones form: warm water (≥ 26.5 °C through ~50 m), instability, a moist mid-troposphere, low shear, a seed disturbance and at least ~5° latitude; the Atlantic season runs June 1 to November 30 and peaks around September 10.
Wind units and averaging. U.S. agencies use the 1-minute sustained wind at 10 m height; most other agencies (and the WMO) use a 10-minute average, which is about 0.88–0.93 times the 1-minute value. So a "100 kt" storm from the Japan Meteorological Agency is stronger than a 100 kt U.S. storm. Gusts are typically 20–30% above the sustained wind.
Why hurricanes weaken
| Cause | Mechanism |
|---|---|
| Landfall: loss of fuel | Over land the storm loses the warm-water supply of heat and moisture, so latent-heat release in the eyewall drops and the warm core cools |
| Landfall: surface friction | Land is much rougher than water. Friction slows the wind, so more air crosses the isobars into the center and fills the low, raising its pressure; terrain also disrupts the circulation |
| Cold water | Moving over water below ~26 °C, or over the cold wake the storm churned up itself (upwelling and mixing), cuts the heat supply; slow storms are most vulnerable to their own wake |
| Vertical wind shear | Tilts and separates the upper warm core from the low-level center; the cloud pattern becomes lopsided with an exposed low-level center |
| Dry air | Dry, dusty air (Saharan Air Layer) mixed into the circulation evaporates cloud and makes stabilizing downdrafts |
| Mountains | High terrain (Hispaniola, Cuba, Mexico's Sierra Madre, Taiwan, the Philippines) tears up the inner core; the storm may re-form on the other side |
| Eyewall replacement | Temporary weakening while a new outer eyewall takes over (see Structure) |
Rapid intensification and other changes
Rapid intensification (RI) is an increase in maximum sustained wind of at least 30 kt (35 mph, 55 km/h) in 24 hours. It is favored by very warm water with a deep warm layer (high ocean heat content, such as the Gulf's Loop Current), low shear, moist air, strong upper-level outflow, and a small, well-organized core. It is hard to forecast because it depends on small-scale processes inside the core. Examples: Katrina over the Loop Current (2005), Harvey in the Gulf (2017), Ian and Ida (2021–22), Milton (2024), Erin and Melissa (2025). Rapid weakening is the opposite. Extreme RI near the coast is the most dangerous scenario because people prepare for a weaker storm.
Extratropical transition. As a storm moves poleward over cooler water and into the westerlies, it meets stronger shear and an air-mass boundary. It becomes lopsided, develops fronts, loses its warm core, and its wind field and rain shield spread out. It may weaken, or it may re-intensify using the temperature contrast like any mid-latitude cyclone (Sandy 2012). A hurricane-force extratropical storm can still bring surge, wind and heavy rain (Erin 2025 stayed hurricane-force after transition).
Fujiwhara effect. When two cyclones come within roughly 1,400 km (about 900 mi) of each other, they begin to rotate around a point between them (counterclockwise in the Northern Hemisphere). The weaker one may be absorbed or merge into the stronger one.

Tracks and what steers them
Tropical cyclones are steered by the large-scale flow around them. In the Atlantic, the trade winds on the south side of the Bermuda-Azores High carry storms west; as a storm reaches the western edge of the high it turns north and then recurves northeast into the westerlies. A strong high pushes storms into the Gulf or the Caribbean; a trough over the eastern United States pulls them north and out to sea. ENSO, terrain and landfall change a storm's strength rather than its steering; see Why hurricanes weaken and the basin notes above.
The steering current is roughly the average wind through a deep layer of the troposphere (about 850 to 200 hPa for a strong storm), not just the surface wind. Typical behavior:
- In the tropics (south of about 25°N): westward or west-northwestward at 10–20 mph in the easterly trades.
- Around the western end of the subtropical high: the track turns north. A storm near 30–35°N is usually moving north.
- After recurvature into the westerlies (often near 25–35°N): northeastward, often accelerating to 30–50 mph or more (the 1938 New England hurricane moved near 60 mph). A storm at 40–45°N off the U.S. East Coast is almost always heading northeast.
- Weak steering (between highs, or under a block): the storm stalls or loops, piling up rain and surge (Harvey 2017 over Texas, Florence 2018 in the Carolinas, Dorian 2019 over Grand Bahama).
- Blocking high to the north: a storm can be forced to turn west into the coast instead of recurving; Sandy (2012) hooked left into New Jersey when a block over Greenland and a deep trough over the eastern U.S. captured it.
- Beta drift: even in a calm environment, a tropical cyclone slowly drifts poleward and westward because the Coriolis effect changes with latitude.
Rule of thumb for rain from forward speed. A slower storm rains longer on one place. A long-used forecaster's rule (the Kraft rule) estimates the maximum storm-total rainfall from the forward speed.
Structure
At the center is the eye, usually about 30 to 65 km (20 to 40 mi) across, where air sinks and warms, skies are often clear and winds are light. Around it is the eyewall, a ring of tall thunderstorms with the strongest winds and heaviest rain. Spiral rainbands curve inward toward the eyewall and can produce tornadoes, especially in the right-front quadrant at landfall. Air spirals in at the surface, rises in the eyewall and flows out at the top, where it turns clockwise (anticyclonic). In the Northern Hemisphere the right side of the storm (relative to its motion) has the strongest winds and highest surge, because the forward motion adds to the rotating winds there. Strong hurricanes sometimes go through eyewall replacement cycles, in which an outer eyewall forms and chokes off the inner one, temporarily weakening the storm while its wind field broadens.

| Part | What happens there | Key facts |
|---|---|---|
| Eye | Gentle sinking air warms adiabatically and dries, dissolving cloud | Lowest pressure; light winds; often clear or partly cloudy; warmest part of the storm; usually 30–65 km (20–40 mi) across, but "pinhole" eyes can be under 10 km |
| Eyewall | A ring of towering cumulonimbus where moist air rises fastest | Strongest winds (the radius of maximum winds) and heaviest rain; cloud tops slope outward like a stadium |
| Rainbands (spiral or feeder bands) | Bands of showers and thunderstorms spiraling in toward the eyewall | Bursts of heavy rain and gusts with lulls between; tornadoes in the outer bands of the right-front quadrant |
| Inflow layer | Lowest 1–2 km; air spirals inward and counterclockwise (NH), picking up heat and moisture from the sea | Friction makes the wind cross the isobars toward the center |
| Central dense overcast (CDO) | Solid shield of cloud tops over the core | On satellite, the eye appears in the CDO as the storm strengthens |
| Outflow | At 12–16 km the air spreads outward and turns clockwise (anticyclonic) | Thin cirrus shield extending hundreds of kilometers; strong, well-ventilated outflow helps the storm intensify |
Why is the eye calm? As air spirals inward it spins faster (like a figure skater pulling in her arms), until it can no longer reach the center: the balance between the inward pressure-gradient force and the outward centrifugal and Coriolis effects stops it at the eyewall. Some air from the top of the eyewall sinks into the eye and warms by compression, which is why the eye is warm, dry and often clear. The calm is temporary: when the eye passes, the opposite eyewall arrives with winds from the opposite direction. Leaving shelter in the eye is deadly.
Eye size and intensity. A larger eye does not mean a stronger storm; intense storms often have small, contracting eyes. An eyewall replacement cycle begins when an outer ring of thunderstorms forms around the eyewall, cuts off the inner eyewall's inflow and replaces it. During the cycle the peak wind drops and the pressure rises slightly, then the storm may re-intensify with a larger eye and a broader wind field (Erin did this in August 2025).
Pressure and wind. The lower the central pressure, and the tighter the pressure gradient around it, the stronger the wind. Typical central pressures: tropical storm around 990–1005 hPa; Category 3 about 945–964 hPa; Category 5 usually below 920 hPa. The record lows are Typhoon Tip (1979, 870 hPa), Patricia (2015, 872 hPa, the Western Hemisphere record) and Wilma (2005, 882 hPa, the Atlantic record). Pressure helps judge strength but the category is set by wind alone; a very large storm can have low pressure but weaker peak winds.
Size. The radius of maximum winds is typically 10–50 km. The wind field is described by NHC's wind radii: how far tropical-storm-force (34 kt), 50-kt and hurricane-force (64 kt) winds extend in each quadrant. Size and intensity are independent: Andrew (1992) was a tiny Category 5, while Sandy's tropical-storm-force winds spanned about 1,000 miles (roughly 870 nautical miles) with only Category 1 winds.
Right side vs left side. In the Northern Hemisphere the storm's rotation and its forward motion add on the right side of the track (relative to motion) and subtract on the left. For a storm moving north, the right side is the east side, and the right-front quadrant is the most dangerous: strongest winds, highest surge (onshore winds pushing water to the coast), and most tornadoes.
Hurricane-spawned tornadoes. Landfalling hurricanes often produce tornadoes, mostly in the outer rainbands of the right-front quadrant, within a day of landfall and up to a few hundred kilometers inland. Strong low-level shear (surface friction slows the low-level wind under fast winds just above) and plenty of moisture produce small, low-topped supercells. These tornadoes are usually weak (EF0–EF2), short-lived, rain-wrapped and hard to warn for. Ivan (2004) produced more than 100; Harvey (2017) about 50. NOAA's Hurricane Research Division notes that almost every tropical cyclone that makes landfall in the U.S. spawns at least one tornado, provided enough of its circulation moves over land; most form in outer rainbands about 50–300 miles from the center, and Gulf coast landfalls (which put a state squarely under the right-front quadrant) produce more than storms that sideswipe the Atlantic coast.
Hail is rare in hurricanes. Their updrafts are relatively weak (the warm, moist tropical sounding has modest buoyancy spread through a deep column) and the freezing level is very high, so ice that forms aloft is small and melts long before it reaches the ground.
Pre-hurricane squall line. Sometimes the first sign of an approaching hurricane is a line of thunderstorms tens of miles ahead of the main rain shield, looking like a mid-latitude squall line.
Hurricanes on satellite and radar
On satellite: a clear eye surrounded by a ring of cold cloud tops in IR, a central dense overcast, and curved banding. On radar: a ring of high reflectivity (the eyewall) around a weak-echo hole (the eye), with spiral rainbands, and on velocity a pair of very strong inbound and outbound maxima on opposite sides of the eye.


| Tool | What a hurricane looks like | What it tells you |
|---|---|---|
| Visible satellite | White spiral, CDO, sharp round eye; shadows of overshooting tops | Organization and eye clarity (daytime only) |
| Infrared satellite | Ring of very cold (brightly colored) tops around a warm eye | Colder ring and warmer eye mean a stronger storm |
| Water-vapor satellite | Dry air (dark) wrapping toward the core; outflow channels | Threats from dry air and shear |
| Microwave satellite | Eyewall and rainbands seen through the cirrus | Hidden eyewall structure, eyewall replacement |
| Radar reflectivity | Ring of high dBZ (eyewall) around a weak-echo eye; spiral bands | Only within ~250 km of the coast; landfall timing |
| Radar velocity | Strong inbound and outbound maxima on opposite sides of the eye | Wind speed aloft; small couplets in bands can mean tornadoes |
The Dvorak technique. Over the open ocean, intensity is estimated from satellite cloud patterns. A forecaster matches the pattern (curved band, CDO, eye) and the temperature contrast between the eye and the surrounding cloud tops to a T-number from 1 to 8, which converts to a wind speed. Automated versions (ADT) run continuously. Approximate Atlantic conversions:
| T-number | 1.0 | 2.0 | 2.5 | 3.0 | 3.5 | 4.0 | 4.5 | 5.0 | 5.5 | 6.0 | 6.5 | 7.0 | 7.5 | 8.0 |
|---|---|---|---|---|---|---|---|---|---|---|---|---|---|---|
| Wind (kt) | 25 | 30 | 35 | 45 | 55 | 65 | 77 | 90 | 102 | 115 | 127 | 140 | 155 | 170 |
So T2.5 is the threshold for a tropical storm and T4.0 for a hurricane. When storms threaten land, Hurricane Hunter aircraft (U.S. Air Force Reserve WC-130Js and NOAA's P-3 and G-IV) fly into them and drop dropsondes to measure wind and pressure directly; see Weather instruments. Buoys, scatterometer satellites (ocean-surface wind) and coastal radar fill in the rest; see Satellite imagery and Doppler radar products.
NHC forecast products
| Product | What it shows | Pitfalls |
|---|---|---|
| Tropical Weather Outlook | Areas being watched, with the chance of formation in 2 days and 7 days (low < 40%, medium 40–60%, high > 60%) | It is not a track forecast |
| Public advisory | Position, maximum sustained wind, pressure, motion, watches and warnings; issued at 5 and 11 a.m./p.m. EDT, with intermediate advisories every 3 hours when coastal watches or warnings are up | Wind is the 1-minute sustained value at 10 m |
| Forecast cone | Probable track of the center, out to 5 days; built from circles that enclose about two-thirds of NHC's track errors over the previous five years | Impacts often extend far outside the cone, and the center leaves the cone about one-third of the time |
| Wind speed probabilities | Chance of 34-, 50- and 64-kt winds at each location | Better for decisions than the cone |
| Storm surge watch/warning and inundation maps | Life-threatening surge possible (watch) or expected (warning); maps of water depth above ground | Surge can arrive before the wind |
| Key messages and discussions | Forecaster reasoning, confidence, hazards | Read for uncertainty |
Spaghetti plots and ensembles. A spaghetti plot draws many model track forecasts, or the members of an ensemble, on one map. Tight bundles mean confidence; a wide spread means uncertainty. The NHC's official forecast is close to a consensus of the best models, which beats any single model on average. A single model run posted days ahead on social media is not a forecast. (Model types and ensembles are covered in Computer models.)
Accumulated Cyclone Energy (ACE) measures a storm's or a season's total activity by combining strength and duration.
The Saffir-Simpson scale
The Saffir-Simpson Hurricane Wind Scale rates a hurricane from 1 to 5 by its 1-minute sustained wind only. It does not include storm surge, rainfall or size, so a Category 1 storm can be deadlier than a Category 4 if it stalls and floods.
| Category | Sustained wind | Typical wind damage |
|---|---|---|
| 1 | 74–95 mph | Some damage to roofs, gutters, trees; power outages |
| 2 | 96–110 mph | Extensive damage; major roof and siding damage; widespread outages |
| 3 (major) | 111–129 mph | Devastating; well-built homes lose roof decking; days to weeks without power |
| 4 (major) | 130–156 mph | Catastrophic; severe damage to well-built homes; area uninhabitable for weeks |
| 5 (major) | 157 mph or more | Catastrophic; a high share of frame homes destroyed |
The same scale in other units, with the central pressures and surge heights that went with each category on the pre-2010 version of the scale (still printed in older textbooks and tests):
| Category | Knots | km/h | m/s | Typical central pressure (old scale) | Surge (old scale) |
|---|---|---|---|---|---|
| Tropical depression | ≤ 33 | ≤ 62 | ≤ 17 | — | — |
| Tropical storm | 34–63 | 63–118 | 18–32 | — | — |
| 1 | 64–82 | 119–153 | 33–42 | ≥ 980 hPa | 4–5 ft |
| 2 | 83–95 | 154–177 | 43–49 | 965–979 hPa | 6–8 ft |
| 3 | 96–112 | 178–208 | 50–58 | 945–964 hPa | 9–12 ft |
| 4 | 113–136 | 209–251 | 58–70 | 920–944 hPa | 13–18 ft |
| 5 | ≥ 137 | ≥ 252 | ≥ 70 | < 920 hPa | > 18 ft |
Storm surge
Storm surge is the rise of seawater above the normal tide, driven by a storm. Most of it comes from the wind stress pushing water toward the coast; a smaller part comes from the low pressure, which lets the sea bulge upward. The storm tide is the surge plus the astronomical tide. Surge is highest where the storm is strong and large, approaches perpendicular to the coast, makes landfall at high tide, and pushes into a shallow, gently sloping shelf or a funnel-shaped bay (the Gulf Coast is especially vulnerable). Height matters because water is heavy: a few feet of moving water can float cars and knock down walls, and historically surge has caused about half of U.S. hurricane deaths. Every foot of extra height extends flooding farther inland on a flat coast.

What controls surge height
| Factor | Higher surge when... | Why |
|---|---|---|
| Wind speed | Stronger | Wind stress grows roughly with the square of wind speed |
| Storm size | Larger wind field | Pushes water over a longer fetch and wider area (Sandy, Ike, Katrina) |
| Angle of approach | Perpendicular to the coast; coast on the right side of the track | Onshore winds pile water directly against the coast; the left side may see water pushed away (negative surge, e.g., Tampa Bay drained during Ian) |
| Forward speed | Depends on coast; fast storms raise open-coast surge, slow storms prolong flooding in bays | Faster motion adds to onshore wind; slow motion keeps water piled up through several tides |
| Bathymetry | Shallow, gently sloping continental shelf | Water cannot return seaward underneath, so it piles up; a steep shelf (e.g., much of Puerto Rico) lets water escape below |
| Coastline shape | Concave bays, funnels and estuaries | Water converges and rises; a convex headland spreads it out |
| Tide | Landfall at high tide (and spring tide) | Adds directly to storm tide |
| Pressure | Lower central pressure | About 1 cm per hPa |
| Waves | Breaking waves add wave setup and battering on top of the surge | Waves riding on a 15-ft surge destroy what still water would only flood |
Why the Gulf Coast and Louisiana are so vulnerable: a very wide, shallow shelf, low-lying land (much of it near or below sea level), sinking deltaic land and lost wetlands that used to absorb surge, and funnel-shaped bays. The highest U.S. surge on record was about 28 ft at Pass Christian, Mississippi, in Katrina (2005).
Forecasting surge. NOAA's SLOSH model (Sea, Lake, and Overland Surges from Hurricanes) computes surge for a storm's track, size and intensity on grids for each stretch of coast. Planners use thousands of hypothetical SLOSH runs to draw evacuation zones; during a storm, NHC runs it with many possible tracks to make probabilistic surge forecasts and inundation maps.
Surge vs tide vs tsunami. A tide is the regular twice-daily rise and fall from the Moon's and Sun's gravity. A storm surge is a weather-driven rise lasting hours, caused by wind and low pressure. A tsunami is a series of very long waves caused by a sudden displacement of the ocean (earthquake, landslide, volcano), unrelated to weather; it can cross an ocean at jet-airliner speed. (A small "meteotsunami" can be driven by a fast-moving squall line's pressure jump.) None of these is the same as long-term sea-level rise: a hurricane does not raise global sea level.
Hazards and deaths. A study of U.S. Atlantic tropical cyclone deaths from 1963 to 2012 found that about half of direct deaths were from storm surge, about a quarter from rainfall flooding (inland, often in vehicles), with surf and rip currents, offshore boating, wind and tornadoes making up the rest; together, water caused roughly 90%. In many recent years with fewer catastrophic-surge landfalls, freshwater flooding and rip currents have been the leading killers. That is why the NHC message is "run from water, hide from wind."
Severe winter storms
Ingredients and cold air. Every winter storm needs cold air (at or below freezing through enough of the column that precipitation reaches the ground frozen), moisture and something to lift the air. Cold air holds very little water vapor because saturation vapor pressure falls steeply with temperature (roughly halving for every 10 °C of cooling; see Humidity: how much water vapor is in the air). So bitterly cold Arctic air produces light, fluffy snow and small liquid totals, while the heaviest snowstorms usually happen with temperatures in the upper 20s °F (about −5 to 0 °C), where air can still carry substantial moisture. It is never truly "too cold to snow," but very cold air rarely produces heavy snow unless a warm lake or ocean supplies the moisture.
Blizzards and snow squalls
Blizzard criteria (NWS): sustained wind or frequent gusts ≥ 35 mph, plus falling and/or blowing snow frequently reducing visibility to less than 1/4 mile, for 3 hours or longer. A storm with 2 ft of snow and light wind is a heavy snowstorm, not a blizzard; a ground blizzard has strong wind lifting and drifting snow that is already on the ground with no new snow falling. A Blizzard Warning can therefore be issued with no snow falling. Blizzards are most common on the northern Plains (the Dakotas, Minnesota), where strong pressure gradients behind Colorado lows and Alberta clippers meet open, flat land with nothing to break the wind. The deadly elements are whiteouts (people get lost or crash), drifting that buries roads and cars, and dangerous wind chill.
Snow squalls are short (often 30–60 minutes), intense bursts of snow with strong, gusty winds that drop visibility to near zero within minutes, often with a sharp temperature fall that flash-freezes wet roads. They usually come with an Arctic cold front or a strong upper-level disturbance and can occur with little total accumulation, which makes them deceptive: many multi-vehicle highway pileups happen in snow squalls. The NWS has issued short-fused, polygon-based Snow Squall Warnings (sent as Wireless Emergency Alerts) since 2018.
Thundersnow is a thunderstorm producing snow instead of rain. It needs deep instability unusual in winter: it occurs in intense lake-effect bands and in the comma head of strong cyclones, and it signals very heavy snowfall rates (2–3+ inches per hour). Falling snow muffles the thunder, so it is heard only a few miles away.
Nor'easters
A nor'easter is a mid-latitude cyclone that tracks northeast along or just off the U.S. East Coast. Ahead of the low (to its north), counterclockwise flow brings strong northeast winds off the ocean onto New England and the mid-Atlantic, which gives the storm its name. They can occur any month but are most frequent and violent from about October (sometimes September) to April. Boston is the classic nor'easter city.
Why they intensify so fast. In winter the boundary between very cold continental air and the warm Gulf Stream creates one of the sharpest temperature contrasts on Earth. An upper-level trough approaching from the west puts upper divergence over this zone; the low deepens on the contrast (baroclinic energy), and the Gulf Stream supplies heat and moisture whose latent heat release in the storm's clouds lowers the pressure further. The polar jet carries the cold air and the steering trough. A cold high over eastern Canada or New England (to the north or northeast of the storm) feeds cold air south at low levels (cold-air damming east of the Appalachians), tightens the pressure gradient (stronger winds), and can slow the storm.
- Track: a low passing near the "benchmark" (40°N, 70°W, southeast of Nantucket) typically gives heavy snow to the big Northeast cities; a track inland brings rain to the coast with snow farther west.
- Origins: some nor'easters form in the Gulf of Mexico and move up the coast (the Storm of the Century, 1993); others form when a low from the Ohio Valley or an Alberta clipper weakens inland and a new secondary low redevelops off the mid-Atlantic coast.
- Hazards: heavy snow and blizzards inland, heavy rain and coastal flooding at the shore (onshore winds pile up water for several tide cycles), beach erosion, high waves, damaging wind and power outages.
- Not a tropical cyclone: a nor'easter is cold core, has fronts and draws energy from temperature contrast, though a strong one can have hurricane-force gusts and a cleared "eye-like" center.
Bombogenesis. A bomb cyclone (explosive cyclogenesis) is a low whose central pressure falls at least 24 hPa in 24 hours, scaled for latitude because the same rotation needs less pressure change at lower latitudes. The rate of 24 hPa per 24 h at 60° latitude is called 1 bergeron.
Clippers and panhandle hooks. An Alberta clipper is a fast, moisture-starved low that drops southeast from Alberta across the northern Plains and Great Lakes, bringing a quick, light-to-moderate snowfall (often 1–6 in), strong wind and a sharp Arctic cold blast behind it. The name comes from the fast clipper ships, sleek sailing ships of the 1800s: the storm "clips" along at high speed. A Panhandle hook forms over the Texas and Oklahoma panhandles, moves east and then hooks northeast toward the Great Lakes, tapping Gulf moisture for heavy snow on its northwest side, ice in the middle and severe storms in its warm sector. Both, like Colorado lows, can produce blizzards and high winds; their origins and tracks are drawn in Mid-latitude cyclones.
Rating snowstorms. The Northeast Snowfall Impact Scale (NESIS) ranks Northeast snowstorms by how much snow falls over how large an area and on how many people, in five categories: 1 Notable, 2 Significant, 3 Major, 4 Crippling, 5 Extreme. NOAA's broader Regional Snowfall Index (RSI) does the same for six regions of the eastern two-thirds of the U.S. The Storm of the Century (1993) and the Blizzard of 1996 rank at the top.
Lake-effect snow
Mechanism. Cold, dry air (often continental polar or Arctic air behind a cold front) blows across a large, relatively warm, unfrozen lake. The lake heats the bottom of the air mass and adds water vapor by evaporation. The bottom layer becomes warm and moist under cold air aloft, so it is strongly unstable; it rises in convective cells and bands, cools, condenses and snows. When the air reaches land, friction slows it and makes it converge (piling up and rising), and hills downwind add orographic lift, so the snow comes down heaviest just inland on the downwind shore.
| Ingredient | Threshold or rule of thumb | Why |
|---|---|---|
| Lake–air temperature difference | Lake surface minus 850 hPa temperature ≥ 13 °C (about the dry-adiabatic difference over 1.5 km) | Makes the lowest layer unstable enough for convection; larger differences mean taller clouds and heavier snow |
| Fetch | At least ~100 km of open water along the wind | Longer time over water = more heat and moisture; winds blowing along a lake's long axis make the most intense single bands |
| Wind direction and shear | Little change in direction (less than ~30°) from the surface to ~700 hPa | Shear tears bands apart; steady direction keeps a band fixed over the same towns |
| Unfrozen lake | Open water | Ice cover cuts off evaporation and heat flux |
| Depth of the unstable layer | Capping inversion high (≥ 1–2 km) | Deeper convection, heavier snow |
| Terrain | Rising land downwind | Orographic lift adds to convection |

Where (snowbelts). The heaviest lake-effect snow falls on the downwind shores, which in the prevailing west and northwest winter flow are the east and southeast sides of the lakes: the Keweenaw Peninsula and Upper Michigan (Lake Superior), western Lower Michigan (Lake Michigan), northeast Ohio, northwest Pennsylvania and the Buffalo Southtowns (Lake Erie), and the Tug Hill Plateau east of Lake Ontario, which averages over 200 in per year. Bands can drop 2–5 in per hour while a few miles away the sun shines. Buffalo's November 2022 storm buried some southern suburbs under more than 6 ft.


When. Lake-effect season runs from about late October or November through February, peaking in late fall and early winter, when the lakes are still warm from summer and Arctic air starts arriving, so ΔT is largest. As winter goes on the lakes cool, ΔT shrinks, and ice cover shuts off the heat and moisture supply. Shallow Lake Erie freezes most often and its season can end by January or February; deep Lake Superior and Lake Ontario rarely freeze completely, so their snowbelts get lake effect all winter.
Variations. Lake-enhanced snow happens when a passing synoptic storm already producing snow gets extra moisture and instability from a lake. The same process occurs elsewhere: the Great Salt Lake, Hudson Bay before it freezes, and ocean-effect (sea-effect) snow on Cape Cod or along the Sea of Japan coast of Japan, where Siberian air crosses the warm sea. Lake-effect storms are not low-pressure systems in the usual sense; they are mesoscale convective bands, so they can bury one town while the regional weather map shows only cold northwest flow.
Ice storms
How the ice forms. An ice storm needs a warm layer aloft (above 0 °C, usually from warm air overrunning a shallow cold layer ahead of a warm front) that fully melts falling snow, and a shallow subfreezing layer at the surface. The raindrops become supercooled as they fall through the cold surface layer but do not have time to refreeze; they freeze on contact with trees, wires, cars and roads, making a clear glaze. (If the cold layer is deep, the drops refreeze into sleet instead. The full set of temperature profiles is in What reaches the ground: temperature layers.) Cold-air damming east of the Appalachians, where cold air from a Canadian high gets trapped against the mountains, makes the Carolinas, Virginia and Georgia ice-storm prone, as are the southern Plains and the Ohio Valley. On the Plains between the Rockies and the Appalachians, most freezing rain and sleet come from two fronts: a shallow, dense Arctic front slides south under the warm air, and moist air overrunning it ahead of a warm front supplies the warm layer aloft.
Impacts by accretion. A few hundredths of an inch makes roads and walkways treacherous. About 1/4 inch or more (the usual Ice Storm Warning criterion; some offices use 1/2 inch) breaks branches and some power lines. A half inch to an inch or more brings down trees, utility poles and transmission towers, with outages lasting days to weeks. The Sperry-Piltz Ice Accumulation (SPIA) index rates expected damage from 0 to 5 using ice amount and wind. The January 1998 ice storm in Quebec, Ontario, northern New York and New England left millions without power, some for weeks.
Snow measurement and snow-to-liquid ratio
The snow-to-liquid ratio (SLR) compares the depth of new snow with the depth of water it melts into. The classic rule of thumb is 10:1, but the true U.S. average is closer to about 12–13:1, and it varies widely: wet, heavy snow near 0 °C may be 5–8:1, while cold, fluffy snow made of dendrite crystals can be 15–30:1 or more (common in lake-effect and Plains snow).
Wind chill and cold
The wind chill (wind chill temperature) is how cold it feels on exposed skin: the air temperature that, in calm conditions, would cause the same rate of heat loss from skin as the actual temperature and wind. Wind strips away the thin layer of warmer air next to the skin, so heat is lost faster. The current NWS formula (adopted in 2001) is based on heat loss from a human face at about 5 ft above the ground, assuming no sun.
| Air temp (°F) | 5 mph | 10 mph | 20 mph | 30 mph | 40 mph | 60 mph |
|---|---|---|---|---|---|---|
| 30 | 25 | 21 | 17 | 15 | 13 | 10 |
| 20 | 13 | 9 | 4 | 1 | −1 | −4 |
| 10 | 1 | −4 | −9 | −12 | −15 | −19 |
| 0 | −11 | −16 | −22 | −26 | −29 | −33 |
| −10 | −22 | −28 | −35 | −39 | −43 | −48 |
| −20 | −34 | −41 | −48 | −53 | −57 | −62 |
Frostbite risk climbs quickly: exposed skin can freeze in about 30 minutes at wind chills near −20 °F, about 10 minutes near −35 °F, and 5 minutes or less near −50 °F (approximate NWS chart values). Wind chill applies only to warm-blooded skin: wind cannot cool a car radiator or a water pipe below the actual air temperature, it only cools them to it faster.
| Cold injury | What happens | Signs | Response |
|---|---|---|---|
| Frostbite | Tissue freezes; most often fingers, toes, ears, nose | Numbness; white, grayish or waxy skin that feels firm | Get warm; rewarm gently in warm (not hot) water; do not rub; seek care |
| Hypothermia | Body core falls below 95 °F (35 °C); possible even above freezing if wet and windy | Shivering, exhaustion, confusion, fumbling, slurred speech, drowsiness | Get to warmth, remove wet clothing, warm the center of the body first, warm drinks if conscious; emergency care |
Deaths in winter storms are mostly indirect: traffic accidents on snow and ice (the single largest share of winter-weather injuries and deaths happen in vehicles), heart attacks while shoveling, carbon-monoxide poisoning from generators or heaters, fires, and hypothermia, especially among the homeless, the elderly and stranded motorists.
Winter weather alerts
| Product | Meaning |
|---|---|
| Winter Storm Watch | Significant snow, sleet or ice possible, usually 12–48 hours ahead |
| Winter Storm Warning | Heavy snow, sleet and/or freezing rain occurring or imminent and threatening life and property; criteria are local (often about 6 in in 12 h or 8 in in 24 h in the Midwest and Northeast, less in the South) |
| Winter Weather Advisory | Winter weather (snow, sleet, freezing rain, blowing snow) causing significant inconvenience, but less severe than a warning |
| Blizzard Warning | Blizzard criteria (35 mph, < 1/4 mile, 3 h) expected or occurring; snow need not be falling |
| Ice Storm Warning | Damaging freezing rain, usually ≥ 1/4 in of ice |
| Snow Squall Warning | Short-fused, polygon warning for a sudden whiteout and flash freeze; triggers phone alerts |
| Extreme Cold Watch / Warning | Dangerously cold air temperatures and/or wind chills; replaced the Wind Chill Watch and Warning on October 1, 2024 |
| Cold Weather Advisory | Cold or wind chill that is hazardous but less extreme; replaced the Wind Chill Advisory in 2024 |
| Lake Effect Snow Warning / Advisory | Used by Great Lakes offices for heavy lake-effect bands |
Droughts and heat waves
A drought is a prolonged shortage of water compared with normal for a place. It is defined by its impacts:
- Meteorological drought: precipitation well below normal for an extended time.
- Agricultural drought: soil moisture too low for crops and pasture.
- Hydrological drought: low streamflow, reservoirs and groundwater, usually lagging the rainfall deficit.
- Socioeconomic drought: when the shortage affects the supply and demand of goods such as water, food or hydropower.
Droughts usually begin with a persistent ridge of high pressure that blocks storms and causes sinking, drying air. Heat increases evaporation, which dries soil, which then lets the sun heat the air instead of evaporating water: a feedback that deepens both drought and heat. ENSO patterns shift drought odds (La Niña often dries the southern United States). The U.S. Drought Monitor rates drought from D0 (abnormally dry) through D1 (moderate), D2 (severe), D3 (extreme) to D4 (exceptional). Effects include crop and livestock losses, wildfire, water restrictions, dust storms and, as in the Dust Bowl, wind erosion of exposed farmland.
Measuring drought
Drought is relative: 10 inches of rain a year is normal in Phoenix and a disaster in Iowa, and drought can strike any climate, not only deserts or the tropics.
| Category | U.S. Drought Monitor label | Rough rarity | Typical impacts |
|---|---|---|---|
| D0 | Abnormally dry | 21st–30th percentile | Going into drought (slowed crop growth) or coming out of it (lingering deficits) |
| D1 | Moderate drought | 11th–20th percentile | Some crop and pasture damage; streams and wells low; voluntary water restrictions |
| D2 | Severe drought | 6th–10th percentile | Crop losses likely; water shortages common; restrictions imposed |
| D3 | Extreme drought | 3rd–5th percentile | Major crop and pasture losses; widespread water shortages; high wildfire danger |
| D4 | Exceptional drought | 0–2nd percentile | Exceptional, widespread losses; water emergencies |
The U.S. Drought Monitor is a weekly map (released Thursdays) made by the National Drought Mitigation Center (University of Nebraska–Lincoln), USDA and NOAA. It blends many indicators (precipitation, soil moisture, streamflow, vegetation health, indices such as Palmer and SPI) with reports from local experts. Labels on the map mark S (short-term, under about 6 months, mainly agricultural impacts) and L (long-term, hydrological and ecological impacts).

The Palmer Drought Severity Index (PDSI), developed by Wayne Palmer in 1965, estimates soil moisture from a running water balance of precipitation, temperature (for evaporation) and the soil's water-holding capacity. Zero is normal; negative values mean drought (−1 to −1.9 mild, −2 to −2.9 moderate, −3 to −3.9 severe, −4 or below extreme), positive values mean wet spells. It responds over months, so it is best for long-term agricultural drought. The Standardized Precipitation Index (SPI) compares precipitation alone with the long-term record over a chosen window (1, 3, 12 months...), so it can show both short and long droughts.
Why one rainstorm does not end a drought. A drought builds a deficit in soil moisture, groundwater and reservoirs over months or years. Rain on hard, dry ground mostly runs off (and can cause flash floods) rather than soaking in, and refilling aquifers and reservoirs takes sustained above-normal precipitation. Hydrological drought therefore ends long after the rain returns.
Causes and types of drought
- Persistent ridges and blocking highs: sinking air warms and dries, suppressing clouds; the storm track is pushed around the ridge.
- Subtropical highs: the world's great deserts and Mediterranean-type dry summers lie under the sinking branch of the Hadley cell; a stronger or displaced subtropical high extends dry seasons.
- ENSO and ocean patterns: La Niña tends to bring drought to the southern U.S. (Southwest to the Southeast) in winter; El Niño tends to bring drought to Indonesia, Australia, southern Africa and India (weaker monsoon) and to the U.S. Ohio Valley and Pacific Northwest in winter. Long-lived patterns of Pacific and Atlantic sea-surface temperature also load the dice for multi-year droughts.
- Rain shadows: downslope warming on the lee side of mountain ranges keeps those areas dry (see Terrain).
- Land-surface feedback: dry soil means less evaporation, so more of the sun's energy heats the air (sensible heat), strengthening the ridge and the heat.
- Flash drought: a drought that develops in weeks rather than months, when heat, sunshine, wind and low humidity rapidly drain soil moisture during a dry spell in the growing season (the central U.S. in summer 2012).
Effects: crop failure and livestock losses, falling reservoir and river levels (hydropower and shipping on the Mississippi), water restrictions, wildfire, insect outbreaks, dust storms, land subsidence from groundwater pumping, and economic losses. Dust storms are worst where drought meets bare, disturbed soil; thunderstorm-driven dust walls (haboobs) are covered under Gust fronts, outflow boundaries and haboobs.
Heat waves and the heat index
A heat wave is a period of abnormally hot weather, usually lasting two days or more and often with high humidity. There is no single national threshold; the NWS issues heat advisories and extreme heat warnings using local criteria, usually based on the heat index (how hot it feels when humidity slows sweat evaporation). Heat waves usually come from a strong, slow-moving upper ridge (a heat dome) where sinking air warms by compression and suppresses clouds. Warm nights are the most dangerous part because the body never recovers. Cities are hotter than their surroundings (the urban heat island). Heat is the leading weather-related killer in the United States in most years.
The heat dome. A strong, stationary ridge in the mid and upper troposphere (high 500 hPa heights) parks over a region, often in a blocking pattern where the upper flow becomes wavy (meridional) and stagnant. Under it: air sinks and warms adiabatically; skies are clear, so sunshine is maximized; winds are light, so there is little mixing; a cap prevents thunderstorms; and dry soils add more heat. The ridge also steers storms around it ("ring of fire" storms along its edge). A blocking high parked for a week typically brings a persistent heat wave, little or no rain (worsening drought), stagnant air with poor air quality and high wildfire danger. Examples: the 1995 Chicago heat wave (humid; more than 700 deaths), the 2003 European heat wave (tens of thousands of deaths), and the June 2021 Pacific Northwest heat dome (Portland 116 °F; Lytton, British Columbia, 121 °F, Canada's all-time record).
The heat index (apparent temperature) combines air temperature with relative humidity. When humidity is high, sweat evaporates slowly, so the body cannot cool itself and it feels hotter than the thermometer reads. The NWS computes it with a regression (Rothfusz) fit to Steadman's model of a person walking in the shade with a light wind; full sunshine can add up to about 15 °F. Related indices: the wet-bulb globe temperature (WBGT), used by the military and athletics, adds sun, wind and humidity; the NWS HeatRisk product (levels 0–4) also accounts for how unusual the heat is for that place and time of year and for warm nights.
| Heat index | NWS category | Possible effects with prolonged exposure or activity |
|---|---|---|
| 80–90 °F | Caution | Fatigue possible |
| 90–103 °F | Extreme caution | Heat cramps and heat exhaustion possible |
| 103–124 °F | Danger | Heat cramps and heat exhaustion likely; heatstroke possible |
| ≥ 125 °F | Extreme danger | Heatstroke highly likely |
Approximate heat index (°F), computed with the NWS formula; values above about 137 °F are off the NWS chart:
| Air temp (°F) | 40% RH | 50% RH | 60% RH | 70% RH | 80% RH | 90% RH |
|---|---|---|---|---|---|---|
| 80 | 80 | 81 | 82 | 83 | 84 | 86 |
| 84 | 83 | 85 | 88 | 90 | 94 | 98 |
| 88 | 88 | 91 | 95 | 100 | 106 | 113 |
| 92 | 94 | 99 | 105 | 112 | 121 | 131 |
| 96 | 101 | 108 | 116 | 126 | > 137 | > 137 |
| 100 | 109 | 118 | 129 | > 137 | > 137 | > 137 |
| 104 | 119 | 131 | > 137 | > 137 | > 137 | > 137 |
Urban heat island (UHI). Cities are warmer than the surrounding countryside, most of all on calm, clear nights. Causes: asphalt, concrete and roofs absorb sunlight (low albedo) and store heat, releasing it at night; few trees and little soil water mean less evaporative cooling; tall buildings trap outgoing longwave radiation and block wind ("urban canyons"); and cars, air conditioners and industry add waste heat. The warmth and roughness of a city can also boost thunderstorms and rainfall downwind of it. Heat waves are deadliest in cities partly because the UHI keeps nights hot.
Heat illness
| Condition | Signs | What to do |
|---|---|---|
| Heat cramps | Painful muscle spasms, heavy sweating | Stop activity, move to a cool place, drink water or a sports drink |
| Heat exhaustion | Heavy sweating; cool, pale, clammy skin; fast, weak pulse; nausea; dizziness; fainting | Move to a cool place, loosen clothing, apply cool wet cloths, sip water; get help if vomiting or worsening |
| Heatstroke (life-threatening) | Body temperature 103 °F (39.4 °C) or higher; hot, red, dry or damp skin; fast, strong pulse; confusion; possible unconsciousness | Call 911, move to a cooler place, cool the body immediately (cool cloths or bath); do not give fluids by mouth |
Those most at risk are older adults, infants, people with chronic illness, outdoor workers and athletes, and people without air conditioning. A closed car heats about 20 °F in 10 minutes even on a mild day; never leave children or pets inside.
Heat alerts. NWS offices issue a Heat Advisory for dangerous heat and an Extreme Heat Watch or Extreme Heat Warning for the most dangerous heat. These "Extreme Heat" products replaced the older "Excessive Heat" Watch and Warning on March 4, 2025 (the Heat Advisory kept its name). Criteria are local (a heat index of 105 °F is routine in parts of Texas but extreme in Seattle). Heat is the deadliest U.S. weather hazard averaged over recent decades, ahead of floods, tornadoes and hurricanes, though in a given year a single disaster can top it.
Fire weather and Red Flag Warnings
Drought and heat dry out vegetation (fuels); wildfires then spread fastest when three weather factors line up: strong, gusty wind, low relative humidity (dry air pulls moisture out of fine fuels like grass within hours) and dry fuels, often with heat and an unstable atmosphere. Downslope winds such as the Santa Ana and Chinook, the gusty, dry air behind a dry cold front, and dry thunderstorms (high-based storms whose rain evaporates as virga while their lightning starts fires, and whose outflow fans the flames) are the classic fire-weather patterns.
The NWS issues two fire-weather products, mainly for land-management and firefighting agencies:
| Product | Meaning | Typical lead time |
|---|---|---|
| Fire Weather Watch | Red Flag conditions are possible soon | About 12–72 hours ahead (some offices up to 96 hours) |
| Red Flag Warning | Red Flag conditions are occurring or imminent: weather plus dry fuels make extreme fire behavior likely | Within about 24–48 hours, or already happening |
Criteria are not national. Each NWS forecast office sets its own Red Flag thresholds with local fire agencies, based on its climate and fuels, and checks that fuels are actually dry (critically dry fuels are part of every definition). For example, the Denver/Boulder office uses frequent gusts of 25 mph or more together with relative humidity of 15% or less for at least 3 hours, or widespread dry thunderstorms; some Plains offices use RH at or below 20–25% with gusts of 25 mph or more. Treat any specific numbers as examples of one office's criteria, not a nationwide rule. The SPC also issues national fire weather outlooks (elevated, critical and extremely critical areas) for days 1–8.
After a fire, the burn scar sheds rain as runoff, so even modest rain can cause flash floods and debris flows (see Floods, debris flows and mudslides).
Hazards of each storm type
Each storm type kills in its own way, and the right protective action follows from the hazard. The table pulls together the hazards from each chapter with the products that warn of them; the alerts themselves are explained in Weather safety.
| Storm type | Main hazards | Leading cause of death | Key NWS products |
|---|---|---|---|
| Severe thunderstorm | Large hail, damaging straight-line winds, lightning, flash flooding, tornadoes | Lightning, flash floods, falling trees | Severe thunderstorm watch (SPC) and warning (local office) |
| Tornado | Extreme winds and flying debris, collapse of structures | Flying debris and collapse, especially in mobile homes | Tornado watch (SPC), tornado warning, tornado emergency |
| Downburst, derecho | Widespread straight-line wind damage, downed trees and power lines, aviation wind shear | Falling trees on homes and vehicles | Severe thunderstorm warning (destructive tag) |
| Hurricane | Storm surge, inland freshwater flooding, wind, tornadoes in rainbands, rip currents and high surf | Storm surge; inland flooding; rip currents | Hurricane and storm surge watches and warnings (NHC), extreme wind warning, flash flood warning |
| Blizzard, nor'easter | Whiteouts, drifting, extreme cold and wind chill, coastal flooding and erosion, roof collapse | Traffic accidents, exposure, overexertion | Blizzard warning, winter storm warning, coastal flood warning |
| Lake-effect storm | Very heavy localized snow, whiteouts on highways | Traffic accidents, stranded motorists | Lake effect snow warning |
| Snow squall | Sudden whiteout, flash freeze | Chain-reaction highway crashes | Snow squall warning |
| Ice storm | Ice-loaded trees and lines, long power outages, glazed roads | Traffic accidents, falls, carbon monoxide, hypothermia during outages | Ice storm warning |
| Extreme cold | Frostbite, hypothermia, frozen pipes | Hypothermia | Extreme cold warning, cold weather advisory |
| Drought | Crop failure, water shortages, wildfire, dust storms | Indirect (wildfire, dust-storm crashes, heat) | Drought Monitor, drought outlooks |
| Heat wave | Heat exhaustion and heatstroke, power-grid strain, poor air quality | Heatstroke | Heat advisory, extreme heat watch and warning |
| Flood, debris flow | Drowning (especially in vehicles), washed-out roads and bridges, buried structures | Driving into flooded roads | Flash flood watch, warning, emergency |
| Dust storm (haboob) | Near-zero visibility, crashes, respiratory problems | Highway crashes | Dust storm warning |
Comparing storms. Tests often ask how a tornado and a hurricane differ: a tornado is a small (tens to hundreds of meters wide), short-lived (minutes) vortex from a supercell, driven by wind shear and a rotating updraft, rated by damage on the EF scale; a hurricane is a large (hundreds of kilometers), long-lived (days to weeks) warm-core cyclone over warm ocean, rated by wind on the Saffir-Simpson scale. A supercell has no "eye"; seeking a calm center in a severe thunderstorm is dangerous nonsense. Hurricanes and typhoons have the lowest sea-level pressures of any large storm (the strongest typhoons fall below 900 hPa); a tornado's core can drop about 100 hPa, but over only a few hundred meters, too small to appear on a weather map.
Weather safety
Watches and warnings
| Product | Meaning | Who issues it |
|---|---|---|
| Watch | Conditions are favorable for the hazard; be prepared | Tornado and severe thunderstorm watches: NOAA's Storm Prediction Center, for large areas and several hours. Hurricane and tropical storm watches: the National Hurricane Center, typically 48 hours before tropical-storm-force winds are expected |
| Warning | The hazard is occurring or imminent; act now | Local NWS forecast offices for tornadoes, severe thunderstorms, flash floods and winter storms, drawn as storm-based polygons; hurricane warnings typically 36 hours ahead |
| Advisory | A less serious hazard that is still an inconvenience or risk | Local NWS offices |
| Emergency (tornado or flash flood) | The rare, highest level of warning: a confirmed, catastrophic threat to life in a populated area | Local NWS offices |
The SPC also issues convective outlooks days ahead, with risk categories from marginal to high, and the NHC issues the forecast cone (which shows the probable track of the center, not the size of the storm or where impacts will happen) and storm-surge warnings.
Other routine products. A Hazardous Weather Outlook (daily, local office) lists possible hazards for the next week. A Special Weather Statement covers hazards that do not reach watch, warning or advisory level, such as a strong but non-severe storm with small hail and gusty winds. A Severe Weather Statement updates an existing warning (cancels it, extends it or describes what the storm is doing). A Public Information Statement shares reports, damage-survey results and event summaries. A Mesoscale Discussion from the SPC explains what forecasters are watching and whether a watch is likely in the next hour or two.
Particularly Dangerous Situation (PDS) wording is added to a rare tornado or severe thunderstorm watch when the SPC expects multiple strong to violent tornadoes or a widespread, intense derecho. A tornado emergency is issued when a violent tornado is confirmed and bearing down on a populated area; a flash flood emergency when a severe threat to life from flash flooding is confirmed or imminent. Newer impact-based warnings add tags: a "considerable" severe thunderstorm warning means ≥ 70 mph wind or ≥ 1.75 in hail, and a "destructive" one (≥ 80 mph or ≥ 2.75 in hail) triggers phone alerts.
Who issues what
The National Weather Service is part of NOAA (the National Oceanic and Atmospheric Administration), which is an agency of the U.S. Department of Commerce; SPC, NHC and the local forecast offices are all NWS units.
| Center | Main products |
|---|---|
| Storm Prediction Center (SPC), Norman, Oklahoma | Convective outlooks (days 1–8), mesoscale discussions, tornado and severe thunderstorm watches, fire-weather outlooks |
| National Hurricane Center (NHC), Miami; Central Pacific Hurricane Center, Honolulu | Tropical weather outlooks, advisories, forecast cone, hurricane, tropical storm and storm surge watches and warnings |
| Weather Prediction Center (WPC), College Park, Maryland | National surface analyses and forecast maps, Excessive Rainfall Outlooks, quantitative precipitation forecasts, winter-weather outlooks, national heat and flood key messages |
| Climate Prediction Center (CPC) | 6–10 and 8–14 day and seasonal outlooks, hazards outlooks, U.S. drought outlooks, ENSO advisories |
| Local Weather Forecast Offices (WFOs), about 120 | All short-fused warnings (tornado, severe thunderstorm, flash flood, snow squall, extreme wind), winter, heat, cold and flood watches/warnings/advisories, local forecasts, damage surveys |
| River Forecast Centers | River stage and flood forecasts used in river flood warnings |
SPC convective outlook categories
| Level | Category | Map color | Meaning |
|---|---|---|---|
| — | General thunderstorms (TSTM) | Light green | Thunderstorms, not expected to be severe |
| 1 | Marginal (MRGL) | Dark green | Isolated severe storms possible |
| 2 | Slight (SLGT) | Yellow | Scattered severe storms possible |
| 3 | Enhanced (ENH) | Orange | Numerous severe storms possible |
| 4 | Moderate (MDT) | Red | Widespread severe storms likely, some intense |
| 5 | High (HIGH) | Magenta | Widespread severe storms expected, including long-lived intense tornadoes or derechos |
Warning criteria
| Warning | Criteria (most of the U.S.) |
|---|---|
| Severe Thunderstorm Warning | A thunderstorm producing, or about to produce, hail 1 inch or larger and/or winds of 58 mph (50 kt) or more, seen by radar or reported by spotters |
| Tornado Warning | A tornado is reported by spotters or the public, or indicated by radar (strong rotation, debris signature) |
| Flash Flood Warning | Flash flooding occurring or imminent (e.g., heavy rain on saturated ground, dam or levee failure, ice jam) |
| Extreme Wind Warning | Sustained surface winds of 115 mph (100 kt) or more, usually in a landfalling major hurricane's eyewall, expected within about an hour |
| High Wind Warning (non-thunderstorm) | Sustained winds ≥ 40 mph for 1 hour or more and/or gusts ≥ 58 mph |
| Hurricane Warning | Sustained winds ≥ 74 mph expected somewhere in the area, issued about 36 hours before tropical-storm-force winds arrive (watch: 48 hours) |
| Tropical Storm Warning | Sustained winds 39–73 mph expected within about 36 hours |
| Storm Surge Warning | Life-threatening inundation from rising water moving inland, generally within 36 hours (watch: 48 hours) |
| Blizzard Warning | Winds ≥ 35 mph with visibility < 1/4 mile in snow for ≥ 3 hours |
| Ice Storm Warning | Freezing rain accumulation of about 1/4 in or more |
Reliable sources
Get warnings from official sources: NOAA Weather Radio, the National Weather Service (weather.gov), the Storm Prediction Center, the National Hurricane Center, Wireless Emergency Alerts on phones, and local emergency management and broadcast meteorologists who relay them. Social-media posts showing a single model run days ahead are not forecasts. Have at least two ways to receive a warning, including one that wakes you at night.
- NOAA Weather Radio All Hazards broadcasts NWS forecasts and warnings 24 hours a day on seven VHF frequencies (162.400–162.550 MHz) from more than 1,000 transmitters. Radios with SAME (Specific Area Message Encoding) can be set to alarm only for your county and chosen alert types, and work during power and cell outages with batteries.
- Wireless Emergency Alerts (WEA) push the most urgent warnings to every capable phone in the polygon, with no app or sign-up: tornado warnings, extreme wind warnings, flash flood warnings (considerable and catastrophic), storm surge warnings, snow squall warnings, dust storm warnings, hurricane warnings and destructive severe thunderstorm warnings, plus non-weather alerts.
- Outdoor warning sirens are meant for people outdoors; they are not designed to be heard inside buildings.
- Local TV and radio meteorologists relay NWS warnings with live radar; emergency management gives evacuation orders and shelter locations.
- An app or a TV crawl is fine as a second source; a single forecast model run, a phone's default weather icon or a viral post is not.
Preparedness and actions
Preparedness means knowing your risks, having a plan and a designated shelter, building a kit (water, food, medications, flashlight, batteries, radio), and knowing your evacuation zone if you live on the coast.
| Threat | What to do |
|---|---|
| Tornado | Go to the lowest floor, in an interior room without windows (basement or storm shelter if available); cover your head. Leave mobile homes and vehicles for a sturdy building. Do not open windows, and do not shelter under highway overpasses |
| Hurricane and storm surge | Evacuate if told to; "run from water, hide from wind." Surge, not wind, is the main reason for coastal evacuation |
| Flash flood | Move to higher ground; never drive or walk into floodwater ("Turn Around, Don't Drown"). About 6 inches of moving water can knock an adult down, about 12 inches can carry away most cars, and 2 feet can carry away SUVs and trucks |
| Lightning | "When thunder roars, go indoors." A building with plumbing and wiring or a hard-topped metal vehicle is safe; trees, open fields, water and open shelters are not. Wait 30 minutes after the last thunder |
| Winter storm and blizzard | Stay off the roads; if stranded, stay with the vehicle, run the engine briefly with the exhaust pipe clear; dress in layers |
| Heat | Stay hydrated and in air conditioning; check on vulnerable neighbors; never leave people or pets in a parked car |
Before a hurricane: know your evacuation zone; leave early if ordered (and leave for surge, not wind); secure or bring in outdoor objects, cover windows with shutters or plywood; fill prescriptions and the gas tank; turn the refrigerator to its coldest setting; when evacuating, turn off utilities if told to (gas, and main power if flooding is expected). After: do not return until officials say it is safe; the calm eye or a sunny morning does not mean the danger is over; avoid floodwater (contamination, live wires) and downed lines; run generators outdoors, far from windows, to avoid carbon-monoxide poisoning.
Lightning plans should cover where to go, how long it takes to get there, and who calls the "all clear" (wait 30 minutes after the last thunder). The physics and the flash-to-bang method are in Lightning.
Stranded in a vehicle
| Hazard | Stay in the car? | Why and how |
|---|---|---|
| Blizzard or winter storm | Stay with the vehicle unless a building is very close and visible | The car is shelter and is easier for rescuers to find; walking in a whiteout gets people lost. Run the engine about 10 minutes per hour for heat with the exhaust pipe cleared of snow (carbon monoxide) and a window cracked; turn on the dome light, tie a bright cloth to the antenna, move arms and legs, and drink fluids |
| Lightning (with or without hail) | Stay in a hard-topped metal vehicle if no building is near | The metal shell carries the current around the occupants to the ground (a Faraday-cage effect), not the rubber tires; close windows, avoid touching metal parts. Convertibles, soft tops, motorcycles and bikes are not safe. In large hail, keep away from windows and cover your head |
| Tornado | Get out to a sturdy building if one is reachable; otherwise do not stay put in the open | If you can safely drive at right angles away from the tornado's path, do so. If debris is flying, either stay in the car, buckled, head below the windows and covered, or lie in a ditch or ravine noticeably lower than the road, covering your head. Never shelter under an overpass |
| Flood | Never drive into water; if water is rising around a stalled car, get out to higher ground | About 1 ft of moving water carries away most cars and 2 ft carries away SUVs and trucks; more than half of flood drownings involve vehicles. If the car is sinking: seatbelt off, window open or broken, children out first, then out yourself |
| Hurricane | Do not be on the road when the storm arrives; if a warning catches you driving, get off the road to the nearest sturdy building or designated shelter | Evacuate early, well before tropical-storm-force winds; roads flood and become blocked by surge and debris. A car is poor shelter from hurricane winds, flying debris, falling trees and rising water: do not try to ride out the storm in a vehicle, in traffic or under an overpass, and never drive into flooded roads |
| Heat | Never leave anyone in a parked car | Interior temperatures rise about 20 °F in 10 minutes, even with windows cracked |
Severe-weather safety myths
| Myth | Fact |
|---|---|
| Open windows to equalize pressure in a tornado | Wastes time and lets in wind and debris; buildings fail from wind, not pressure difference. Go to shelter immediately |
| Highway overpasses are safe tornado shelters | They funnel wind and debris and leave you exposed above ground; people have died there |
| The southwest corner of a basement is safest | The safest spot is under sturdy cover, away from windows and from heavy objects on the floor above |
| Tornadoes don't hit cities, valleys, rivers or mountains | They have struck all of them (Joplin, Tuscaloosa, Nashville, downtown Salt Lake City) |
| A tornado watch means a tornado has been seen | A watch means conditions are favorable; a warning means one is reported or radar-indicated |
| Rubber tires protect you from lightning in a car | The metal body protects you; tires make no difference |
| Metal objects (jewelry, phones, umbrellas) attract lightning | Height, an isolated position and a pointed shape decide where lightning strikes; carrying metal does not make you a target, though metal conducts current if you are hit |
| Lightning never strikes the same place twice | It often does; the Empire State Building is struck about 20–25 times a year |
| If it isn't raining, there is no lightning danger | Lightning can strike more than 10 miles from the storm ("bolt from the blue") |
| Lying flat on the ground is safest outdoors in lightning | It increases exposure to ground current; the only safe places are a building or hard-topped vehicle |
| The calm eye means the hurricane is over | The back eyewall arrives with violent winds from the opposite direction |
| It's only a Category 1 or a tropical storm | Most hurricane deaths are from water, which does not depend on category |
| A car can drive through shallow floodwater | Water depth is hard to judge, roads may be washed out, and a foot of moving water floats most cars |
| Heat only matters in the afternoon sun | Hot nights, high humidity and closed cars are deadly; heat kills more Americans than any other weather hazard over the long term |
| Wind chill can freeze water pipes at 35 °F | Wind cannot cool objects below the air temperature |
Historic severe events and recent data
The rules limit historic case studies to a closed list, and they say you will be given the data rather than asked to recall it. What you need is enough background to recognize what a map, graph or table is showing and to explain it.
The closed list: the Galveston hurricane (1900), Andrew (1992), Katrina (2005), Sandy (2012), Ida (2021), Ian (2022), Hilary (2023), Helene (2024), Erin (2025) and Melissa (2025); the Blizzard of 1888; the Dust Bowl; the Xenia tornado in the 1974 Super Outbreak; the April 2011 tornado outbreaks; the Great Flood of 1993; and the 1993 Storm of the Century. Each is profiled below.
Closed-list case files
Numbers below come from NHC Tropical Cyclone Reports and NWS event pages where available; wind speeds are 1-minute sustained, pressures are minimum central pressure. Death tolls vary by source and by whether indirect deaths are counted.
Hurricanes
| Storm | Dates and track | Peak and landfall | Deaths and cost | Meteorology to recognize |
|---|---|---|---|---|
| Galveston (1900) | Crossed Cuba, then the Gulf; landfall Sept 8, 1900, at Galveston, Texas | Category 4 (about 140 mph, ~936 hPa) at landfall | ~8,000 (estimates 6,000–12,000), about a fifth of the island's population | Surge of about 15 ft over an island whose highest point was under 9 ft. Little warning: no satellites or radio reports from ships at sea, the U.S. Weather Bureau expected the storm to recurve and dismissed Cuban forecasters, and residents had no evacuation route. Afterward the city built a 17-ft seawall and pumped dredged sand to raise the grade of the island by up to several meters behind it |
| Andrew (1992) | Aug 16–28; crossed the Bahamas, south Florida (Aug 24), then landfall in Louisiana (Aug 26) | Category 5, 165 mph, 922 hPa at Homestead, Florida (upgraded from Cat 4 in 2002) | 26 direct deaths (65 total); about $27 billion, the costliest U.S. storm until Katrina | Very small, compact storm: extreme wind damage in a narrow swath (Homestead), modest surge except Biscayne Bay (~17 ft). Showed wind damage from poor construction; led to Florida's stronger building codes. The first named storm of a quiet (El Niño) season: "it only takes one" |
| Katrina (2005) | Aug 23–30; Cat 1 landfall in south Florida, then the Gulf | Peak Cat 5 (175 mph, 902 hPa) over the Gulf's Loop Current; Category 3 landfall at Buras, Louisiana (125 mph, 920 hPa) Aug 29, then near the Louisiana–Mississippi border | About 1,400 deaths (NHC's revised count; older sources ~1,800); $125 billion (2005 dollars), tied with Harvey as the costliest U.S. hurricane | Huge wind field kept a Cat 5-size surge though winds had dropped: ~28 ft at Pass Christian, Mississippi, the highest U.S. surge on record. In New Orleans, surge-driven levee and floodwall failures flooded about 80% of the city; most deaths were by drowning. Rapid intensification over the Loop Current |
| Sandy (2012) | Oct 22–29; Jamaica, Cuba (Cat 3), Bahamas, then north | Became post-tropical just before landfall near Brigantine, New Jersey, Oct 29, with 80 mph winds and 945 hPa | 147 direct deaths (72 in the U.S.); about $65–70 billion | Enormous size (tropical-storm-force winds about 1,000 miles across). A blocking high near Greenland and a deep trough over the eastern U.S. turned it sharply left (west) into New Jersey instead of out to sea; merged with the trough ("Frankenstorm," "Superstorm"). Record storm tide at the Battery in New York (about 14 ft above low water); subway and tunnel flooding. States affected: worst surge in New Jersey, New York and Connecticut (4–6 ft of inundation on western Connecticut's coast); the center then crossed southern New Jersey, northern Delaware and southern Pennsylvania, with wind damage and power outages in Pennsylvania (over a million customers), Maryland, Delaware and Virginia; up to 36 in of snow in the Appalachians of West Virginia (hardest hit) and western North Carolina |
| Ida (2021) | Aug 26–Sept 1; Cuba, Gulf of Mexico | Rapidly intensified; landfall at Port Fourchon, Louisiana, on Aug 29 (the 16th anniversary of Katrina) with 150 mph (Cat 4), ~931 hPa, tying the strongest Louisiana landfalls | 87 U.S. deaths (55 direct), more than half in the Northeast; about $75 billion | Remnants merged with a front over the Northeast on Sept 1: Central Park's record ~3.15 in of rain in one hour, the first flash flood emergency ever for New York City, deaths in basement apartments and cars in New York and New Jersey, plus tornadoes in New Jersey and Pennsylvania |
| Ian (2022) | Sept 23–30; western Cuba (Cat 3), Gulf | Peak Category 5 (160 mph) just before landfall, upgraded in the final report; landfall at Cayo Costa, southwest Florida, Sept 28 as a Category 4 (150 mph), ~940 hPa; second landfall in South Carolina (Cat 1) | Over 150 deaths; about $112 billion, the costliest Florida hurricane | Surge of roughly 10–15 ft above ground at Fort Myers Beach and Sanibel; slow motion caused record freshwater flooding across central Florida; strong negative surge emptied Tampa Bay on the storm's left side |
| Hilary (2023) | Aug 16–21; eastern Pacific off Mexico | Peak Category 4 well offshore; weakened over cooler water and landfall in Baja California as a tropical storm (Aug 20); remnants crossed Southern California and Nevada | 3 deaths (U.S. and Mexico); about $900 million | First tropical storm watches and warnings ever issued by NHC for the southern California coast. Record August rain: Death Valley's wettest day on record (2.20 in), flooding and debris flows in the desert Southwest; shows how eastern Pacific moisture reaches the U.S. |
| Helene (2024) | Sept 24–27; western Caribbean, Gulf | Rapidly intensified; landfall in Florida's Big Bend near Perry, late Sept 26, as a Category 4 (140 mph), ~939 hPa | At least 250 U.S. deaths (at least 175 direct), the deadliest mainland U.S. hurricane since Katrina | Very large and fast-moving, so hurricane-force gusts reached far inland (Georgia). Heavy rain fell before arrival (a predecessor rain event) on the southern Appalachians, then the storm's rain on top, with upslope lift: up to ~30 in and catastrophic flooding in western North Carolina (Asheville, Swannanoa, Chimney Rock) and east Tennessee, far from the coast |
| Erin (2025) | Aug 11–22; Cabo Verde storm with a parabolic track around the Atlantic | Category 5, 160 mph (140 kt), ~913 hPa on Aug 16 north of the Leeward Islands; winds rose 45 kt in 12 hours | 13 direct deaths (flash flooding in Cabo Verde, rip currents and surf) | Extreme rapid intensification; concentric eyewalls and an eyewall replacement cycle; grew very large (in the 92nd to 95th percentile of size for Atlantic hurricanes north of 20°N) and passed about 175 n mi off Cape Hatteras, bringing dangerous surf, rip currents and overwash to the Outer Banks and much of the East Coast without landfall |
| Melissa (2025) | Late Oct; slow-moving in the central Caribbean | Peak 190 mph (165 kt), 892 hPa on Oct 28; landfall near New Hope, southwestern Jamaica, Oct 28 at about 185 mph (160 kt), ~897 hPa; then Cuba (Cat 3) and the Bahamas | 93 deaths (count in the revised NHC report); catastrophic damage in Jamaica | Tied the 1935 Labor Day hurricane and Dorian (2019) for the strongest Atlantic landfall on record by sustained wind; prolonged rapid intensification over very warm water; slow motion produced extreme rain and flooding in Jamaica and Haiti |
Winter storms, floods, drought and tornadoes
| Event | Dates and area | Key data | Meteorology to recognize |
|---|---|---|---|
| Blizzard of 1888 ("Great White Hurricane") | March 11–14, 1888; Chesapeake Bay to Maine, centered on New York, Connecticut, Massachusetts and New Jersey | 40–50 in of snow in parts of Connecticut, Massachusetts and New York (about 21 in in New York City); winds over 45 mph; drifts to 40–50 ft; more than 400 deaths | A nor'easter: a coastal low intensified rapidly off the mid-Atlantic, drawing Arctic air from Canada into Atlantic moisture. Rain turned to heavy snow as temperatures crashed. It paralyzed New York, toppled overhead telegraph and power lines and led the city to put utilities underground and build its subway |
| Dust Bowl | 1930s (worst 1934–1938); southern Great Plains: Oklahoma and Texas panhandles, western Kansas, southeastern Colorado, northeastern New Mexico | Repeated drought years plus record heat (1934, 1936); "Black Sunday," April 14, 1935; hundreds of thousands migrated west | Drought plus human causes: deep plowing of native grassland for wheat ("the great plow-up"), no cover crops, overgrazing. Strong winds lifted bare topsoil into black blizzards. Responses: the Soil Conservation Service (1935), contour plowing, crop rotation, cover crops and shelterbelts of trees planted across the Plains (planted from 1935 on, during and after the Dust Bowl, not before it) |
| 1974 Super Outbreak and Xenia, Ohio | April 3–4, 1974; 148 tornadoes in 13 states (Alabama, Georgia, Illinois, Indiana, Kentucky, Michigan, Mississippi, New York, North Carolina, Ohio, Tennessee, Virginia, West Virginia) and Ontario | About 315–335 deaths (sources differ); 30 tornadoes rated F4 or F5; the Xenia F5 (afternoon of April 3) killed 32–34 people (sources differ) and destroyed much of the city | A deep low over the Midwest, a powerful jet stream and strong low-level shear over a warm, moist air mass. Was the largest outbreak on record until April 2011. Led to expanded NOAA Weather Radio, better warning systems and building on Ted Fujita's damage surveys |
| April 2011 outbreaks | April 4–5; April 14–16 (Oklahoma to North Carolina and Virginia); and the April 25–28 "Super Outbreak" | April 25–28: about 360 tornadoes in 21 states from Texas to New York; 324 tornado deaths, nearly all on April 27; four EF5s on April 27 (Hackleburg–Phil Campbell and Rainsville, Alabama; Smithville and Philadelphia, Mississippi); the Tuscaloosa–Birmingham EF4 | Hardest hit: Alabama (about 250 deaths), Mississippi, Tennessee, Georgia and Virginia, plus Arkansas, Kentucky and Louisiana. A strong trough and jet with very high shear and instability over the Southeast (Dixie Alley), where tornadoes are often fast, rain-wrapped and at night. April 2011 set a record for the most tornadoes in a month (about 750) |
| Great Flood of 1993 | Mainly June–August 1993 (high water April–October); upper Mississippi and Missouri basins: Minnesota, Wisconsin, Iowa, Illinois, Missouri, Kansas, Nebraska, South Dakota, North Dakota (nine states declared disaster areas) | About 50 deaths; roughly $15 billion; over 1,000 levees failed; the Mississippi at St. Louis stayed above flood stage for months | Soils were already saturated from a wet fall and spring. A persistent blocking pattern: a ridge (Bermuda High) over the East and a trough over the West held a stationary front over the Midwest, so nightly MCSs fed by the Gulf low-level jet trained over the same basins for weeks |
| Storm of the Century ("Superstorm '93") | March 12–14, 1993; Gulf of Mexico to the Maritimes, 26 states | Pressure fell to about 960 hPa; ~270–320 deaths; 13 in of snow at Birmingham, Alabama, 56 in on Mount LeConte, Tennessee; blizzard conditions from Alabama to New England; storm surge up to about 12 ft on Florida's Big Bend coast; 11 tornadoes in Florida | Formed in the western Gulf along a front near the Texas coast and became a bomb as an intense upper trough dug into the Gulf; a squall line raked Florida and Cuba. Top of the NESIS ranking. One of the first major storms forecast days ahead by computer models, allowing unprecedented early blizzard warnings and closings |
Other storms that appear on tests
These are not on the closed list, but older invitational tests ask about them often, and they make good examples of each process.
| Storm | Landfall and strength | Why it is famous |
|---|---|---|
| Patricia (2015), eastern Pacific | Peak 215 mph (185 kt), 872 hPa, the strongest reliably measured Western Hemisphere hurricane; landfall in Jalisco, Mexico, as a Cat 4 (about 150 mph) | Extreme rapid intensification (tropical storm to Cat 5 in about a day) over very warm water |
| Harvey (2017) | Cat 4 (130 mph) near Rockport, Texas (northeast of Corpus Christi), Aug 25 | Stalled for days: 60.58 in of rain near Nederland, Texas, the U.S. tropical cyclone record; catastrophic Houston flooding; about $125 billion; dozens of tornadoes |
| Irma (2017) | Cat 5 (185 mph) over the Leeward Islands (Barbuda, St. Martin); Cat 4 landfall at Cudjoe Key, Florida Keys, then Cat 3 at Marco Island | Surge and wind in the Keys and southwest Florida; one of the longest-lived Cat 5s |
| Maria (2017) | Cat 5 landfall on Dominica; Cat 4 across Puerto Rico (Sept 20) | Island-wide power loss for months; thousands of excess deaths in Puerto Rico; Maria did not hit the U.S. mainland |
| Michael (2018) | Cat 5 (160 mph, 919 hPa) at Mexico Beach, Florida Panhandle, Oct 10, 2018 | Strongest Panhandle landfall; only the fourth Cat 5 U.S. landfall; rapid intensification right up to landfall |
| Florence (2018) | Cat 1 at Wrightsville Beach, North Carolina (after peaking at Cat 4) | Slow motion: about 36 in of rain and record flooding in the Carolinas; proof that category is not the whole story |
| Dorian (2019) | Cat 5 (185 mph) in the northwestern Bahamas; stalled over Grand Bahama about a day | Catastrophic surge and wind in Abaco and Grand Bahama; with Lorenzo, one of 2019's two Atlantic Cat 5s |
Recent Atlantic seasons (not on the closed list). Season totals are from the NHC Tropical Cyclone Report index (named storms / hurricanes / major hurricanes, Cat 3+); ENSO state is for the August–October peak, from NOAA's Oceanic Niño Index. Landfall dates are in UTC, so an evening landfall in U.S. local time can carry the next day's date.
| Season | NS / H / MH | ENSO at peak | Notable storms (landfall place, date, category at landfall) |
|---|---|---|---|
| 2017 | 17 / 10 / 6 | Neutral, turning to La Niña in fall | Harvey: San Jose Island near Rockport, Texas, Aug 26 UTC (late Aug 25 local), Cat 4. Irma: Barbuda Sept 6, Cat 5; Cudjoe Key, Florida Keys, Sept 10, Cat 4. Maria: Dominica Sept 19 UTC, Cat 5; Puerto Rico Sept 20, Cat 4 |
| 2018 | 15 / 8 / 2 | Neutral, weak El Niño developing | Florence: Wrightsville Beach, North Carolina, Sept 14, Cat 1 (peaked Cat 4). Michael: Mexico Beach / Tyndall AFB, Florida, Oct 10, Cat 5 |
| 2019 | 18 / 6 / 3 | Neutral (weak El Niño fading) | Dorian: Elbow Cay, Great Abaco, Bahamas, Sept 1, Cat 5 (160 kt, 185 mph), then Grand Bahama Sept 2 (Cat 5), then Cape Hatteras, North Carolina, Sept 6 (Cat 2). Lorenzo: Cat 5 in the central Atlantic. Jerry: a short-lived hurricane, about 1.5 days at hurricane strength (peak 90 kt, Cat 2, Sept 20) that passed north of the Leeward Islands and, as a remnant, near Bermuda; no landfall |
| 2020 | 30 / 14 / 7 (record) | La Niña | Record named storms; Greek letters used. Laura: Cameron, Louisiana, Aug 27, Cat 4. Eta and Iota: Nicaragua in November, both Cat 4 |
| 2021 | 21 / 7 / 4 | La Niña (second year) | Ida: Port Fourchon, Louisiana, Aug 29, Cat 4. Fred: St. Joseph Peninsula near Cape San Blas, Florida, Aug 16, tropical storm (55 kt); 6 flash-flood deaths in western North Carolina and 31 tornadoes in total from Georgia to New England (no rapid intensification) |
| 2022 | 14 / 8 / 2 | La Niña (third year) | Fiona: southwestern Puerto Rico, Sept 18, Cat 1 (peak Cat 4), then Nova Scotia as a record-deep extratropical cyclone. Ian: Cayo Costa, Florida, Sept 28, Cat 4 |
| 2023 | 20 / 7 / 3 | El Niño (strong) | Idalia: Keaton Beach, Florida Big Bend, Aug 30, Cat 3. Above-normal season despite El Niño because of record-warm Atlantic water |
| 2024 | 18 / 11 / 5 | Neutral (La Niña developing late) | Beryl: Carriacou, Grenada, July 1, Cat 4 (earliest Atlantic Cat 5 on record on July 2); Matagorda, Texas, July 8, Cat 1. Helene: near Perry, Florida, Sept 27 UTC (late Sept 26 local), Cat 4. Milton: Siesta Key, Florida, Oct 10 UTC (evening Oct 9 local), Cat 3 |
| 2025 | 13 / 5 / 4 | Neutral, near La Niña thresholds | Erin: Cat 5, no hurricane landfall (it crossed Santo Antão, Cabo Verde, as a new tropical storm). Melissa: southwestern Jamaica, Oct 28, Cat 5 |
Recent storm data. The rules also call for recent storm data, preferably from 2022 to 2027. Expect current radar loops, SPC storm reports, Drought Monitor maps, NHC track and cone graphics and surge maps from recent seasons. Practice reading these from SPC, NHC and NWS event-summary pages: name the feature, give the cause, and state the hazard.
Common pitfalls
A watch is not a warning
A watch means conditions favor the hazard over a broad area; a warning means it is happening or imminent near you. Warnings for tornadoes, severe storms and flash floods come from local NWS offices; tornado and severe-thunderstorm watches come from the Storm Prediction Center.
Saffir-Simpson is wind only
Category says nothing about surge, rain or size. Most hurricane deaths come from water, so a weaker, slower storm can be deadlier.
Velocity colors show motion along the beam only
A strong wind blowing across the radar beam reads near zero. Rotation is a couplet of inbound next to outbound, not a single bright color, and a TVS does not prove a tornado is on the ground; a debris signature on correlation coefficient is much stronger evidence.
Shear helps thunderstorms but hurts hurricanes
Strong vertical shear organizes supercells and squall lines; the same shear tilts and weakens a tropical cyclone.
Severe means hail, wind or a tornado
The NWS criteria are 1-inch hail, 58 mph gusts or a tornado. Lightning and heavy rain, however dangerous, do not make a storm "severe" by definition.
Sleet and freezing rain differ in the cold layer
Both need a warm layer aloft. A deep cold layer at the surface refreezes the drops into sleet; a thin one leaves supercooled drops that freeze on contact as freezing rain.
A 100-year flood is a 1% chance each year
It can happen two years in a row, and over 30 years the chance of at least one is about 26%.
Opening windows does not save a house
Pressure equalization is a myth; opening windows wastes time and lets wind and debris in. Get to shelter instead.
How tournaments test this
The archive holds 1,965 Division B Meteorology questions from four seasons (2017, 2020, 2021 and 2024), 928 of them from 2024. The practice bank holds 15,338 Meteorology questions from 2014 to 2026: about 6,500 are exported from or match archived Meteorology tests of either division, and about 8,700 come from older tournament tests the archive does not have. Both sets come from a mix of themes, so use them for phrasing and practice and the 2027 rules for deciding what is in scope.
- Format. Free response is the largest type, at 978 of 1,965 (about 50%). Multiple choice is 720 (about 37%), true-false 159 (8%), select-all 85 (4%) and numeric 23 (1%). Explanations carry the most points, which matches the rule that reasoning is scored.
- Tasks. "Explain why" is the most common task (about 9.9% of archived questions), then "which of the following" (6.7%), compare and contrast (2.6%), interpret a graph or table (2.0%), true-false (2.0%) and calculations (1.8%). Because at least half the 2027 test must rest on data displays, expect far more image and map interpretation than these tags suggest.
- Severe-weather topics in the archive and bank. The word "hurricane" appears in 658 prompts, "thunderstorm" in 518 and "tornado" in 413, so there is a deep pool of practice for the new theme.
- Recurring terms across the archive and bank include air mass (293 questions), wind speed (188), low pressure (154), cold front (116), jet stream (97), Coriolis effect (105), Doppler radar (85) and lake effect (68).
- What the in-scope questions are about. Of about 15,300 bank questions, roughly 8,500 touch topics the 2027 rules still cover; the rest belong to the Climate and Everyday Weather rotations (greenhouse effect, atmospheric layers, optics, fog types). Among the in-scope ones, the largest groups are humidity, lapse rates and stability (about 11%), pressure, Coriolis and global circulation (10%), thunderstorms (7%), fronts (6.5%), tropical cyclones (6%), air masses (6%), severe-weather clouds (5%), radar (4.5%), jet streams and upper-air charts (4%), tornadoes (4%), and observing instruments, station models and METAR, and satellites (about 3 to 4% each). The fundamentals in the first chapters of this guide therefore carry about half the points.
- Most common correct answers include cumulonimbus (68 questions), cold front (30), infrared (24), hail (22) and freezing rain (19).
The largest archive sources are the Sierra Vista Invitational 2024 (146 questions) and the Rustin Invitational 2020 (143). Typical severe-weather questions: identify a radar feature from an image, compute the distance to lightning, rank storms on a scale from damage descriptions, explain why a hurricane weakened, choose the protective action for a scenario, or read a sounding for stability.
Test yourself
These are real tournament questions from the public archive; each links to its full test. The explanations add the reasoning the official key does not give.
- 1
How do Doppler radars work?
1 question from this set is no longer available.
Practice more Meteorology questions →
- 1
How many stages are there in a thunderstorm's life cycle
Practice more Meteorology questions →
- 1
Tornadoes can be made up of 2 or more smaller tornadoes called suction vortices. Circle fact or myth.
Practice more Meteorology questions →
More practice from the question bank, grouped by topic. These come from real invitational tests; the explanations are ours.
- 1
Which of the following is not an ingredient for a thunderstorm?
From: Holt Invitational 2017, Division B
Practice more Meteorology questions →
- 1
Which of these air masses would bring warm, humid conditions to the continental United States?
From: Pembroke Hill Invitational 2025-26, Division B
Practice more Meteorology questions →
- 1
Which type of environmental wind is necessary for the formation of a rotating supercell thunderstorm with a mesocyclone?
From: Rickards Invitational '20-21, Division B
Practice more Meteorology questions →
- 1
What are the differences between the Fujita scale and the Enhanced Fujita scale?
From: Mira Loma Invitational 2020, Division B
Practice more Meteorology questions →
Condensed facts
Condensed facts: formulas and conversions
| Unit | Standard sea level | 1 unit = |
|---|---|---|
| hPa = mb | 1013.25 | 100 Pa |
| inHg | 29.92 | 33.86 hPa |
| mmHg (torr) | 760 | 1.333 hPa |
| kPa | 101.325 | 10 hPa |
| psi | 14.7 | 68.95 hPa |
Condensed facts: humidity and stability
| Measure | Units | Changes if air warms/cools (no vapor added)? |
|---|---|---|
| Vapor pressure e | hPa | No |
| Saturation vapor pressure eₛ | hPa | Yes (temperature only; ~7%/°C, doubles per 10 °C) |
| Mixing ratio w / specific humidity q | g/kg | No (conserved in rising unsaturated air) |
| RH | % | Yes: falls on warming, peaks near sunrise |
| Dew point T_d | °C/°F | No (true moisture gauge; ≥ 60s °F = severe fuel) |
| Wet bulb T_w | °C | Yes; always T_d ≤ T_w ≤ T |
| eₛ / wₛ | −10 °C | 0 °C | 10 °C | 20 °C | 30 °C | 40 °C |
|---|---|---|---|---|---|---|
| eₛ (hPa) | 2.9 | 6.1 | 12.3 | 23.4 | 42.5 | 73.9 |
| wₛ at 1000 hPa (g/kg) | 1.8 | 3.8 | 7.7 | 14.9 | 27.6 | 49.7 |
| Stability | Lapse-rate order | Parcel | Weather |
|---|---|---|---|
| Absolutely stable | ELR < MALR < DALR (or inversion) | Sinks back | Stratus, fog, trapped smog |
| Conditionally unstable | MALR < ELR < DALR | Buoyant once saturated past LFC | Cu → Cb with a trigger (usual severe case) |
| Absolutely unstable | MALR < DALR < ELR | Rises at once | Superadiabatic surface layer, dust devils |
Condensed facts: scales and thresholds
| Rating | F scale (pre-Feb 1, 2007) | EF scale 3-s gust | Damage |
|---|---|---|---|
| 0 | 40–72 mph | 65–85 mph | Shingles, branches |
| 1 | 73–112 | 86–110 | Roofs stripped, mobile homes overturned |
| 2 | 113–157 | 111–135 | Roofs off, mobile homes destroyed, big trees snapped |
| 3 | 158–206 | 136–165 | Stories destroyed, trains overturned, trees debarked |
| 4 | 207–260 | 166–200 | Well-built houses leveled |
| 5 | 261–318 | > 200 | Houses swept off foundations |
EF: 28 damage indicators, degrees of damage, highest rating supported; EF-U = no damage indicators. No F6 ever.
| Saffir-Simpson | mph | kt | km/h | Old pressure | Old surge |
|---|---|---|---|---|---|
| TD | ≤ 38 | ≤ 33 | ≤ 62 | — | — |
| TS (named) | 39–73 | 34–63 | 63–118 | — | — |
| 1 | 74–95 | 64–82 | 119–153 | ≥ 980 hPa | 4–5 ft |
| 2 | 96–110 | 83–95 | 154–177 | 965–979 | 6–8 ft |
| 3 (major) | 111–129 | 96–112 | 178–208 | 945–964 | 9–12 ft |
| 4 | 130–156 | 113–136 | 209–251 | 920–944 | 13–18 ft |
| 5 | ≥ 157 | ≥ 137 | ≥ 252 | < 920 | > 18 ft |
TC stages: disturbance (organized storms ≥ 24 h, no closed circulation) → invest (90–99 + basin letter) → potential TC (land impacts ≤ 48 h) → depression → storm → hurricane → major. RI = +30 kt in 24 h. Dvorak T2.5 = TS (35 kt), T4.0 = hurricane (65 kt), T8.0 = 170 kt. Super typhoon ≥ 130 kt.
| Hail | in | Hail | in |
|---|---|---|---|
| Pea | 0.25 | Ping-pong/walnut | 1.50 |
| Marble | 0.50 | Golf ball | 1.75 |
| Penny (old severe) | 0.75 | Hen egg (significant) | 2.00 |
| Nickel | 0.88 | Tennis ball | 2.50 |
| Quarter (severe) | 1.00 | Baseball | 2.75 |
| Half dollar | 1.25 | Grapefruit / softball | 4.00 / 4.50 |
| Threshold | Value |
|---|---|
| Severe thunderstorm | Hail ≥ 1 in, gust ≥ 58 mph (50 kt), or tornado |
| "Considerable" / "destructive" tag | ≥ 70 mph or ≥ 1.75 in / ≥ 80 mph or ≥ 2.75 in |
| Hail / drizzle / rain size | Hail ≥ 5 mm; drizzle < 0.5 mm; rain ≥ 0.5 mm |
| Blizzard | ≥ 35 mph + vis < 1/4 mi + ≥ 3 h (no snow amount or temp) |
| Ice storm warning | ≥ ~1/4 in ice (some offices 1/2) |
| High wind (non-storm) | ≥ 40 mph sustained 1 h and/or gusts ≥ 58 mph |
| Extreme wind warning | ≥ 115 mph (100 kt) sustained, Cat 3+ eyewall |
| Microburst / macroburst | < 4 km (2.5 mi) / ≥ 4 km |
| Derecho | Classic ≥ 250 mi (400 km); 2016 ≥ ~400 mi × 60 mi; 58 mph most of path, several ≥ 75 mph |
| MCC (satellite) | ≤ −32 °C over ≥ 100,000 km², ≤ −52 °C core ≥ 50,000 km², ≥ 6 h, axis ratio ≥ 0.7 |
| TC formation | SST ≥ 26.5 °C (80 °F) to ~50 m; shear < ~20 kt; lat ≥ ~5° |
| Lake effect | Lake − 850 hPa ≥ 13 °C; fetch ≥ ~100 km; shear < ~30° |
| Bomb | ≥ 24 hPa / 24 h at 60° (scaled by sin φ) |
| Atmospheric river | IVT ≥ ~250 kg m⁻¹ s⁻¹; AR 1–5 scale |
| ENSO | Niño 3.4 ≥ +0.5 °C (El Niño), ≤ −0.5 °C (La Niña) |
| Bulk 0–6 km shear | < 20 kt single cell; 20–40 multicell; ≥ 40 kt supercell |
| SRH | 0–3 km > 150 supercells, > 300 strong; 0–1 km > 100–150 tornadoes (m²/s²) |
| SPC level | Category | Color | Meaning |
|---|---|---|---|
| — | TSTM | Light green | Non-severe storms |
| 1 | Marginal | Dark green | Isolated severe |
| 2 | Slight | Yellow | Scattered severe |
| 3 | Enhanced | Orange | Numerous severe |
| 4 | Moderate | Red | Widespread, some intense |
| 5 | High | Magenta | Widespread incl. long-track tornadoes/derechos |
| Drought Monitor | Label | Percentile | Palmer (PDSI) |
|---|---|---|---|
| D0 | Abnormally dry | 21–30 | −1 to −1.9 mild |
| D1 | Moderate | 11–20 | −2 to −2.9 moderate |
| D2 | Severe | 6–10 | −3 to −3.9 severe |
| D3 | Extreme | 3–5 | ≤ −4 extreme |
| D4 | Exceptional | 0–2 | — |
Weekly (Thursdays), NDMC + USDA + NOAA; S = short-term (< 6 mo, agricultural), L = long-term (hydrological).
| Heat index | Category | Effect |
|---|---|---|
| 80–90 °F | Caution | Fatigue |
| 90–103 | Extreme caution | Cramps, exhaustion possible |
| 103–124 | Danger | Exhaustion likely, heatstroke possible |
| ≥ 125 | Extreme danger | Heatstroke highly likely |
Shade + light wind; full sun adds up to ~15 °F. Heat index 96 °F/60% ≈ 116; 92 °F/70% ≈ 112. Heatstroke ≥ 103 °F body. Hypothermia < 95 °F core. Frostbite ~30 min at −20 °F WC, ~10 min at −35, ≤ 5 min at −50.
| Beaufort | Name | kt | mph | Sign |
|---|---|---|---|---|
| 0 | Calm | < 1 | < 1 | Smoke vertical |
| 8 | Gale | 34–40 | 39–46 | Twigs break (= TS threshold) |
| 12 | Hurricane force | ≥ 64 | ≥ 74 | Sea completely white |
Wind chill (°F): 0 °F at 10/20/30/60 mph → −16/−22/−26/−33; 20 °F at 20 mph → 4; −10 °F at 20 mph → −35.
Condensed facts: station model and METAR
| Station model position | Element | Decode |
|---|---|---|
| Upper left | Temperature | °F (U.S.) |
| Lower left | Dew point | °F; gap = depression |
| Far left | Visibility | Statute miles |
| Left middle | Present weather | • rain, , drizzle, * snow, ▽ shower, ▲ hail, △ sleet, ~ hook freezing, ≡ fog, = mist, ∞ haze, )( funnel/tornado |
| Center circle | Sky cover | Oktas; X = obscured; M = missing |
| Shaft | Wind direction | Points to where wind comes FROM |
| Barbs | Speed | Half 5, full 10, pennant 50 kt; double circle = calm |
| Upper right | SLP | Code < 500 → prefix 10; ≥ 500 → prefix 9; tenths (147 = 1014.7; 876 = 987.6) |
| Right | 3-h tendency | Tenths hPa (+28 = +2.8) + trace |
| Lower right | Past weather, precip | 6-h symbol; inches |
| METAR group | Example | Meaning |
|---|---|---|
| Time | 122253Z | Day 12, 2253 UTC |
| Wind | 27035G52KT / VRB04KT / 00000KT | From 270° true, 35 G52 kt / variable / calm |
| Visibility | 1/2SM, M1/4SM, 10SM, 9999 | Statute mi; M = less than; 9999 = ≥ 10 km |
| Intensity | -RA / RA / +RA | Light / moderate / heavy; +FC = tornado |
| Descriptors | TS, SH, FZ, BL, DR, VC | Thunder, shower, freezing, blowing (> 6 ft), drifting, vicinity 5–10 mi |
| Precip | RA DZ SN SG GR GS PL IC UP | Rain, drizzle, snow, grains, hail, graupel, sleet, ice crystals, unknown |
| Obscuration | BR / FG / HZ FU DU SA VA | Mist (5/8–6 mi) / fog (< 5/8 mi) / haze smoke dust sand ash |
| Sky | FEW 1–2/8, SCT 3–4/8, BKN 5–7/8, OVC 8/8 | Base in hundreds ft AGL (BKN015 = 1,500 ft) |
| Ceiling | Lowest BKN/OVC or VV | VV002 = obscured, 200 ft |
| Cloud type | CB, TCU | Only these two coded |
| Temp/dew | 17/M06 | 17 °C / −6 °C |
| Altimeter | A2968 / Q1011 | 29.68 inHg / 1011 hPa (≠ SLP) |
| Remarks | AO2, SLP134, PK WND 27058/2241 | Precip discriminator; 1013.4 hPa; peak 58 kt at 2241Z |
| Remarks | T02220183, P0012, 52012 | 22.2/18.3 °C; 0.12 in hourly; rising 1.2 hPa in 3 h |
Condensed facts: air masses and fronts
| Air mass | Source | Properties | U.S. weather |
|---|---|---|---|
| cA | Arctic, N Canada, Greenland | Bitter cold, very dry, very stable | Record cold, light fluffy snow, lake effect |
| cP | Interior Canada, Alaska | Cold, dry, stable | Clear and cold behind cold fronts |
| mP | N Pacific, N Atlantic | Cool, moist | Pacific coast rain, mountain snow; New England damp |
| mT | Gulf, Caribbean, subtropical oceans | Warm, humid, unstable | Fuel for severe storms east of Rockies |
| cT | Desert SW, Mexican plateau | Hot, very dry, capped aloft | Heat, drought, fire; source of Plains cap |
| mE | Equatorial oceans | Hot, saturated | Arrives inside tropical cyclones |
k = colder than surface (unstable, showers); w = warmer (stable, stratus/fog). Densest: cold, dry. Source regions: highs with light winds, flat uniform surface.
| Front | Symbol | Slope, speed | Weather |
|---|---|---|---|
| Cold | Blue triangles | Steep 1:50–1:100; ~2× warm-front speed | Narrow band Cb, squall line, then clearing |
| Warm | Red semicircles | Gentle 1:200–1:300 | Ci → Cs → As → Ns; wide steady precip; sleet/ZR in cold air |
| Stationary | Alternating, opposite sides | Little motion | Days of rain, flooding, new lows |
| Occluded | Purple, same side | Wraps N of low | Mix; cold-type or warm-type |
| Dryline | Brown/orange open scallops | E by day, W at night | Supercells on moist (east) side |
| Trough / squall line / tropical wave | Dashed orange / red dash-dot-dot / orange | — | Wind shift / storm line / easterly-wave trough |
| Passage | Cold before → after | Warm before → after |
|---|---|---|
| Temperature | Warm → drops sharply | Cool → rises |
| Dew point | High → drops | Rising → rises |
| Wind | S/SW → W/NW gusty | E/SE → S/SW |
| Pressure | Falling → lowest, then rising sharply | Falling steadily → levels off |
| Clouds | Cu/Cb → clearing | Ci thickening to Ns → clearing |
| Precip | Short, heavy → ending | Long, steady → ending |
Dryline passage: dew point drops ≥ 20 °F in a few miles, wind veers SE → SW/W, temperature may rise. Backdoor front: from NE/E, drops 10–20 °F. Thunderstorm passage on meteogram: pressure jump, temp drop, gust spike.
Condensed facts: circulation, cyclones and jets
| Feature | Hurricane | Mid-latitude cyclone |
|---|---|---|
| Core | Warm; weakens with height | Cold; strengthens with height |
| Energy | Latent heat, warm ocean | Temperature contrast (fronts) |
| Shear | Needs weak | Needs strong jet |
| Size | 200–1,000 km | 1,000–3,000+ km |
| Strongest wind | Surface eyewall | Aloft (jet) |
| Aloft | Outflow anticyclone | Trough to west |
Condensed facts: clouds and precipitation
| Cloud | Level/base | Meaning |
|---|---|---|
| Ci, Cs, Cc | High ~5–13 km, ice | No precip at ground; warm-front lead |
| As, Ac | Middle 2–7 km | As: light precip/virga |
| St, Sc, Ns | Low < 2 km | Ns: steady rain/snow |
| Cu → Cu congestus → Cb calvus → Cb capillatus incus | Vertical, tops 12–15 km (18 km tropics) | Only Cb makes thunder, lightning, hail |
| Wall cloud | Under rain-free updraft base, SW/S side | Inflow, rotation, tornado risk |
| Shelf cloud (arcus) | Leading edge, attached | Gust front: wind coming |
| Roll cloud | Detached tube | Outflow boundary, not a tornado |
| Mammatus / pileus | Under anvil / cap over tower | Sinking air / rapid updraft |
| Tail cloud, beaver tail, clear slot | Near wall cloud | Inflow; clear slot = RFD |
| Scud / virga | Ragged fragments / evaporating streaks | False tornado / microburst warning |
| Profile (cloud → ground) | Result |
|---|---|
| Below 0 °C throughout | Snow |
| Weak warm layer aloft + deep cold surface layer | Sleet (hard, refrozen) |
| Deep warm nose + shallow cold surface layer | Freezing rain (glaze) |
| Shallow warm-topped cloud, sub-freezing surface | Freezing drizzle |
| Deep above-freezing near ground | Rain |
Warm-front banding (U.S.): snow → sleet → freezing rain → rain toward the front. Bergeron: eₛ(ice) < eₛ(water), best −10 to −20 °C. Collision-coalescence: warm clouds. Riming → graupel (soft, 2–5 mm) → hail. Aggregation near 0 °C. Dendrites −12 to −18 °C. Raindrops = hamburger buns, break at 5–6 mm. Rime = small drops freeze instantly (opaque); glaze = large drops spread (clear). Hail: clear layer = wet growth, milky = dry growth; updraft ~10 m/s pea, ~29 m/s golf ball, ≥ 45 m/s softball; impact energy ∝ D⁴.
| Flood | Timing | Note |
|---|---|---|
| Flash | ≤ ~6 h after rain | Training/back-building; top thunderstorm killer |
| Urban (pluvial) | Minutes–hours | Impervious surfaces |
| River (fluvial) | Days–weeks | Crest forecastable; 1993 Mississippi |
| Coastal | Hours | Storm surge |
| Debris flow / mudslide | Minutes after intense rain | Burn scars; steep saturated slopes |
Condensed facts: radar and satellite
| dBZ | Color | Meaning |
|---|---|---|
| < 5–15 | Blue-gray | Clear air, insects, drizzle |
| 15–30 | Green | Light rain |
| 30–40 | Green–yellow | Moderate rain |
| 40–50 | Yellow–orange | Heavy rain, cores begin |
| 50–60 | Red | Very heavy, possible small hail |
| 60–65 | Dark red–magenta | Hail likely |
| > 65 | Magenta–white | Large hail almost certain |
| Signature | Product | Meaning |
|---|---|---|
| Hook echo | Reflectivity | Rain around mesocyclone, right-rear (SW) flank |
| Debris ball | Reflectivity | Lofted debris at hook tip |
| BWER / WER | Reflectivity sections | Violent updraft; hail grows at edges |
| Three-body scatter spike | Reflectivity | Large hail; spike points away from radar |
| V-notch / inflow notch | Reflectivity | Very strong updraft / strong inflow |
| Bow echo, rear-inflow notch, bookend vortex | Refl. + velocity | Worst wind at apex; brief tornadoes at ends (north comma head) |
| Fine line | Reflectivity | Gust front, outflow, dryline |
| Mesocyclone | Velocity | Broad in/out couplet across beam |
| TVS | Velocity | Gate-to-gate couplet (not proof of tornado) |
| TDS | CC < ~0.8 + ZDR ~0 | Tornado on ground doing damage |
| Divergence along a radial | Velocity | Downburst (near in, far out); convergence = reverse |
| Hail core | 60+ dBZ, ZDR ~0, CC 0.80–0.95 | Hail |
| Heavy rain | High Z, high ZDR, CC ~1, high KDP | Very heavy rain |
| Melting layer | Ring of low CC, high ZDR | Rain/snow line; bright band |
| Channel | λ | Senses | Night? | Bright = | Best for |
|---|---|---|---|---|---|
| Visible | ~0.6 µm (band 2) | Reflected sunlight | No | High albedo | Texture, overshooting-top shadows, boundaries |
| Shortwave IR | ~3.9 µm | Emitted + reflected | Yes | Varies | Night fog, fires |
| Water vapor | 6–7 µm (bands 8–10) | Mid/upper moisture | Yes | Moist upper air | Jets, troughs, dry slots, ARs |
| Longwave IR | 10–12 µm (band 13) | Emitted heat | Yes | Cold = high tops | Top height, night storms |
GEO (GOES): 35,786 km, full disk 10 min, CONUS 5 min, mesoscale 1 min; GOES-East (GOES-19) ~75° W, West (GOES-18) ~137° W; ABI 16 channels; GLM total lightning. LEO (JPSS, NOAA-20/21): ~800–850 km, sun-synchronous, ~twice daily. Satellite features: enhanced-V/cold-U (severe), overshooting top, comma cloud + dry slot, CDO + eye, arc cloud, cloud streets, MCC round cold shield.
Condensed facts: storms at a glance
| Storm type | Shear | Life | Hazards |
|---|---|---|---|
| Single cell (pulse) | Weak | 30–60 min | Brief rain, lightning, pulse hail/microburst |
| Multicell cluster | Moderate | Hours (cells 30–60 min) | Moderate hail, flash floods; new cells SW |
| Squall line | Moderate | Hours | Straight-line wind, bow echoes, brief tornadoes |
| Supercell (LP / classic / HP) | Strong, veering | 1–4+ h | Giant hail, violent tornadoes; HP rain-wrapped |
| MCS / MCC | Variable | 3–12+ h | Widespread wind, flooding; MCC overnight summer Plains |
Condensed facts: watches, warnings and safety
| Product | Meaning | Issuer |
|---|---|---|
| Outlook | Days ahead | SPC (days 1–8), NHC (2/7-day: low < 40%, med 40–60%, high > 60%), WPC, CPC |
| Watch | Conditions favorable | SPC (tornado, severe tstm); NHC (tropical, ~48 h); WFO (flood, winter, heat) |
| Warning | Occurring/imminent | Local WFO polygons; NHC hurricane/TS/surge (~36 h) |
| Advisory | Less serious hazard | WFO |
| Emergency / PDS | Confirmed catastrophe / multiple violent tornadoes expected | WFO / SPC |
NWS ⊂ NOAA ⊂ Dept. of Commerce. ~120 WFOs. Tornado warning: reported or radar-indicated; lead time ~8–13 min. New names: Extreme Cold Watch/Warning + Cold Weather Advisory (Oct 1, 2024, replaced wind chill); Extreme Heat Watch/Warning (Mar 4, 2025, replaced Excessive Heat). Snow Squall Warning since 2018. Sources: NOAA Weather Radio (162.400–162.550 MHz, SAME), WEA, sirens (outdoors only), broadcast, weather.gov.
| Threat | Action |
|---|---|
| Tornado | Lowest floor, interior windowless room, cover head; leave mobile homes; never overpass; no window opening |
| Tornado in car | Sturdy building; or drive at right angles; else buckled, head down, or ditch lower than road |
| Lightning | Building with plumbing/wiring or hard-topped metal car (body, not tires); 30/30 rule; struck person safe to touch |
| Flash flood | Higher ground; 6 in knocks adult down, 12 in carries away most cars, 2 ft SUVs/trucks; "Turn Around, Don't Drown" |
| Hurricane | Evacuate for surge; "run from water, hide from wind"; generator outdoors; eye ≠ over |
| Blizzard in car | Stay; run engine ~10 min/h with exhaust clear; window cracked; bright cloth |
| Heat | AC, hydrate, never leave anyone in car (+20 °F in 10 min) |
Condensed facts: historic events
| Event | Date | One-line key |
|---|---|---|
| Galveston | Sep 8, 1900 | Cat 4 ~140 mph; ~8,000 dead; 15 ft surge; 17-ft seawall, grade raising |
| Andrew | Aug 24, 1992 | Cat 5 165 mph, 922 hPa Homestead; tiny; building codes; El Niño year |
| Katrina | Aug 29, 2005 | Cat 3 at Buras (peak Cat 5 902 hPa, Loop Current); ~28 ft Pass Christian; levee failures; ~1,400 dead |
| Sandy | Oct 29, 2012 | Post-tropical at Brigantine NJ, 945 hPa; ~1,000 mi wind field; Greenland block turned it left |
| Ida | Aug 29, 2021 | Cat 4 150 mph Port Fourchon; remnants Sep 1: NYC first flash flood emergency, 3.15 in/h |
| Ian | Sep 28, 2022 | Cat 4 150 mph Cayo Costa (peak Cat 5); 10–15 ft surge; negative surge Tampa Bay; ~$112 B |
| Hilary | Aug 20, 2023 | TS landfall Baja; first S. California TS warnings; Death Valley 2.20 in |
| Helene | Sep 26, 2024 | Cat 4 140 mph Big Bend; predecessor rain + upslope; ~30 in western NC; ≥ 250 dead |
| Erin | Aug 2025 | Cat 5 160 mph, 913 hPa; extreme RI (+45 kt/12 h); ERC; no landfall, Outer Banks surf |
| Melissa | Oct 28, 2025 | 185 mph Jamaica landfall (peak 190 mph, 892 hPa); ties strongest Atlantic landfall |
| Blizzard of 1888 | Mar 11–14, 1888 | Nor'easter; 40–50 in; > 400 dead; NYC buried utilities, subway |
| Dust Bowl | 1930s | Drought + plowed grassland; Black Sunday Apr 14, 1935; shelterbelts, SCS 1935 |
| 1974 Super Outbreak / Xenia | Apr 3–4, 1974 | 148 tornadoes, 13 states; 30 F4–F5; Xenia F5 32–34 dead |
| April 2011 | Apr 25–28, 2011 | ~360 tornadoes, 21 states; 324 dead (Apr 27); 4 EF5s; Dixie Alley; ~750 in April |
| Great Flood of 1993 | Jun–Aug 1993 | Upper Mississippi/Missouri; blocking + stationary front + nightly MCSs; > 1,000 levees failed |
| Storm of the Century | Mar 12–14, 1993 | Gulf bomb ~960 hPa; 26 states; Big Bend 12 ft surge; forecast days ahead; top NESIS |
Records: Tri-State 1925 (219 mi, 695 dead); El Reno 2013 widest 2.6 mi; Bridge Creek–Moore 1999 ~300 mph; Joplin 2011 EF5 158 direct; Vivian SD 2010 8.0 in hail; Harvey 60.58 in; Tip 870 hPa, Patricia 872, Wilma 882.
Condensed facts: top pitfalls
- Watch = favorable (SPC); warning = happening (local office). Lightning and heavy rain do not make a storm "severe."
- Saffir-Simpson = 1-min sustained wind only (5 categories); EF = damage-inferred 3-s gust. F before Feb 1, 2007; EF after.
- Velocity is radial only; zero ≠ calm; reflectivity red (heavy) ≠ velocity red (outbound). TVS ≠ confirmed tornado.
- Shear builds supercells but kills hurricanes. Hurricanes weaken over land mainly from lost fuel.
- Sleet = deep cold surface layer; freezing rain = shallow. Graupel = rimed snow, not small hail by definition.
- 100-year event = 1%/yr; 26% in 30 years.
- Compare dew points, not RH; RH can fall as moisture rises. Wet bulb never above dry bulb.
- Adiabatic cooling = expansion, no heat exchange. Dry rate always > moist rate.
- METAR times UTC; heights hundreds of ft AGL; M = minus; altimeter ≠ SLP; wind direction = from.
- Jets at 30,000–39,000 ft, westerly in both hemispheres. Katabatic = cold gravity wind; Santa Ana/Chinook = compressional warming. Myths: open windows, overpasses, SW basement corner, rubber tires.
- Lake effect: warmer lake or colder air aloft = more snow; frozen lake = none.
- Wind chill cannot cool objects below air temperature; blizzard has no snowfall requirement.
- Hurricane right side worst (NH); NHC max wind already includes forward motion. Cone = center track only; center exits ~1/3 of the time.
References and further reading
- Science Olympiad, 2027 Division B Meteorology (Severe Weather & Storms) rules manual, available from soinc.org; the official rules govern the event.
- SciOly Wiki, Meteorology (a cross-check, not a source of rules): https://scioly.org/wiki/index.php/Meteorology
- NWS JetStream, online school for weather (thunderstorms, tornadoes, hurricanes, radar, soundings): https://www.weather.gov/jetstream/
- NOAA National Severe Storms Laboratory, Severe Weather 101: https://www.nssl.noaa.gov/education/svrwx101/
- Storm Prediction Center: outlooks, watches, storm reports, the EF scale and the derecho pages: https://www.spc.noaa.gov/
- National Hurricane Center: the Saffir-Simpson scale, storm surge overview and Tropical Cyclone Reports for each historic storm: https://www.nhc.noaa.gov/
- NWS Radar Operations Center and the NWS dual-polarization training pages (correlation coefficient and debris signatures): https://www.roc.noaa.gov/
- NWS Safety pages (tornado, lightning, flood, winter, heat): https://www.weather.gov/safety/
- NOAA Atlas 14 Precipitation Frequency Data Server (IDF curves and return periods): https://hdsc.nws.noaa.gov/pfds/
- U.S. Drought Monitor: https://droughtmonitor.unl.edu/
- Maddox, R. A. (1980), "Mesoscale Convective Complexes", Bulletin of the American Meteorological Society 61 (the MCC criteria).
- American Meteorological Society, Glossary of Meteorology: https://glossary.ametsoc.org/
- Practice more: the Scio.ly test archive has public Meteorology tests from several seasons; filter by division to find the Division B questions used here.